

It’s paramount when structuring an investment portfolio to understand not only the expected risk and return profile of each component of the portfolio but how these components move in relation to each other throughout history. The measurement of these relationships is often expressed through a single statistic - correlation. Correlation simply helps explain the directional movement of one asset class compared to another over time. In our first writing for RQA Insights, we highlighted the tremendous risk-reduction benefits of finding quality investment components, or return streams, that exhibit low correlations to each other over time. While the overall lack of correlation between portfolio components is vitally important, using only one data point to explain an entire historical relationship has its flaws. For example, let’s take a deeper look at the two most common investments found in traditional portfolios (defined here): US Stocks (“Stocks”) and US Treasuries (“Bonds”).
In recent memory, Stocks and Bonds have largely been complementary, meaning they have exhibited low, or even negative, correlations to each other. Looking back over a more extended period of history, however, paints a very different picture. More specifically, as presented in Figure 1 below, we can see that the low correlation between the two asset classes was largely a phenomena of the last two decades (1998 through today), where the average correlation for the period was negative 26.7%. Expanding to the prior two decades (1980’s and 1990’s), the correlation was actually persistently positive, averaging over 40%.
Figure 1: Rolling Correlation Between Stocks and Bonds

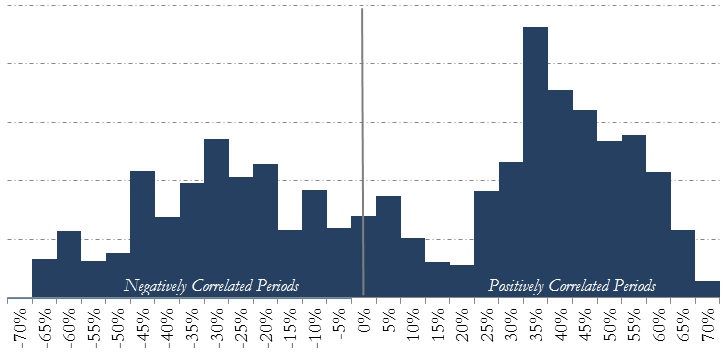
Another way of viewing this Stock/Bond relationship is the distribution of the historical correlations between these two asset classes over the last 40 years, as depicted in Figure 2 below. The characteristics of this distribution once again suggest that, contrary to common belief, Bonds have not always acted as good diversifiers to Stocks throughout history. More specifically, the distribution is uneven and exhibits clustering around both positive and negative 35%. This data snapshot suggests the relationship between Stocks and Bonds is non-stationary and typically varies within economic regimes. Further analysis of this relationship has also been researched and presented in depth in academia (see Shiller and Campbell).
Figure 2: Historical Correlation Distribution Between Stocks and Bonds
Although recent history has told us that Bond and Stock prices are negatively correlated, adding to their overall diversification benefits, this truism has not always been entirely valid throughout market cycles, as evidenced above. Moreover, recent market activity may be indicating that this favorable, low-correlation relationship is reaching another turning point, as markets experienced an environment where rising rates (i.e. Bond price declines) acted as a major catalyst for abrupt downward volatility in Stocks this past February. As both Stocks and Bonds moved in the same direction over the same time period for consistent fundamental reasons, it is important to better understand the relationship between these two asset classes over multiple market regimes and how this dynamic may affect portfolio diversification assumptions going forward. Some key factors that need to be considered in today’s market environment are:
i) 30-years ago, interest rates were at or near record highs, with short-term rates near 20%, providing ample runway for interest rate cuts by the US Federal Reserve (the "Fed"), particularly in times of economic recession or financial crisis;
ii) Persistent easy-money policies initiated by the Fed and other global central banks have led to a prolonged downward trend in interest rates, leading to a long-term bull market in bonds and other major asset classes;
iii) The Fed has started to reverse its easy-money policies from the past few decades by systematically reducing the size of its balance sheet and raising interest rates; and
iv) Interest rates today remain near all-time lows, reducing the effectiveness of rate reductions going forward in the case of economic recession or crisis.
Conclusion
When analyzing the historical relationship between Stocks and Bonds, the overall correlation statistic for the last 40 years has been 1.76%, suggesting these two portfolio components are essentially uncorrelated. It is very important to note, however, that this correlation is non-stationary, shifting within a wide range of positive and negative values depending largely on market regime fundamentals. More specifically, the negatively correlated periods have been dominated by the past two decades, due to persistently declining interest rates and easy Fed policies. It is this more recent 20-year relationship between Stocks and Bonds that may mislead market participants going forward, as embedded recency biases in investors’ minds could lead many to believe that Bond price moves will ultimately counter or offset those of Stocks, particularly in more troubling environments. However, when we take a longer-term look at the historical data, this is certainly not the case. With potential inflationary signals causing increases in volatility and downward price pressure in both Stocks and Bonds, it is prudent to pay attention to the correlation statistic between these two core portfolio components and what it could mean for overall portfolio diversification and expected returns going forward.
Disclaimer: These materials have been prepared solely for informational purposes and do not constitute a recommendation to make or dispose of any investment or engage in any particular investment strategy. These materials include general information and have not been tailored for any specific recipient or recipients. Information or data shown or used in these materials were obtained from sources believed to be reliable, but accuracy is not guaranteed.