

RQA Indicator Spotlight: Commodity Price Trends
In this month’s economic data spotlight, we take a look at recent trends within a basket of a broad set of commodities (“RQA Aggregated Commodities Index” or the “Commodity Index”). The Commodity Index is a diversified benchmark index that includes a broad range of commodities from various sectors, such as energy, metals, agriculture, and livestock. It serves as a representative measure of the overall performance of the commodities market, allowing investors to track price movements and trends in the commodities sector.
Commodity prices can significantly impact the United States' economy. Rising commodity prices can stimulate economic growth in regions that are major commodity producers, such as energy-rich states, by increasing export revenues and encouraging investments. However, the overall U.S. economy can face challenges when commodity prices surge, particularly oil prices, which can lead to increased production costs and potentially slower economic growth. Additionally, commodity price fluctuations, especially in energy and food, can influence inflation in the United States. When commodity prices rise, businesses may pass on higher costs to consumers, contributing to cost-push inflation and affecting overall price levels. While the U.S. economy is diverse and not solely reliant on commodities, these price fluctuations can still have significant implications for inflationary pressures and may influence monetary policy decisions made by the Federal Reserve.

Source: Norgate Premium Data.
Recent trends have shown a significant increase in the Commodity Index, surging by more than 18% in 2022, contributing to the broader inflationary landscape. Although price increases moderated in 2023, the recent upticks in oil prices have exerted additional upward pressure on the Commodity Index. This has raised concerns that inflation might persist at elevated levels for a longer duration than initially anticipated. On the growth front, the ongoing rise in commodity prices is likely to continue impacting consumer spending patterns and could potentially act as a drag on overall economic growth. As the Federal Reserve closely monitors these developments, the data may exert additional pressure for further interest rate hikes to address inflation concerns.
Economic Forecast Model
The RQA Economic Forecast Model, though still in positive territory, experienced a slight decline during August, shifting from 0.14 in July to 0.05 by the end of the month. This places the model's overall output in a neutral range, lacking clear signals of imminent growth or softness. The majority of leading indicators considered by the model continue to present mixed signals regarding the prospects of future economic growth. While the shift towards positive model readings over the past few months is an encouraging sign for growth, we will want to monitor the strength in the reading and see continued firmness across the data set.

Source: Analysis by RQA. Data from U.S. Federal Reserve; Bureau of Labor Statistics; Norgate Premium Data; Institute for Supply Management
The RQA Economic Forecast Model represents a consolidated composite of key economic leading indicators and market-based explanatory variables. The goal of this composite model is to present a holistic measure of primary U.S. economic growth drivers and their trends over time. (Additional detail on the model’s construction is provided here.)
Values above the zero-line are indicative of positive U.S. economic growth expectations in the near-term, and therefore, indicate economic strength and lesser chance of recessionary pressure. On the other hand, values below the zero-line represent the opposite - a more negative outlook and more elevated probabilities of the U.S. experiencing an economic contraction.
TAKING A CLOSER LOOK AT THE ECONOMIC DRIVERS
In the economic heatmap below, we are able to peak under the hood at a wide mix of underlying growth drivers in the U.S. economy. By reviewing this underlying data in more detail, we are better able to see how the underlying components of the U.S. economic growth picture are behaving through time. The indicators presented below have each proven to have predictive qualities in estimating the future direction of U.S. economic growth.
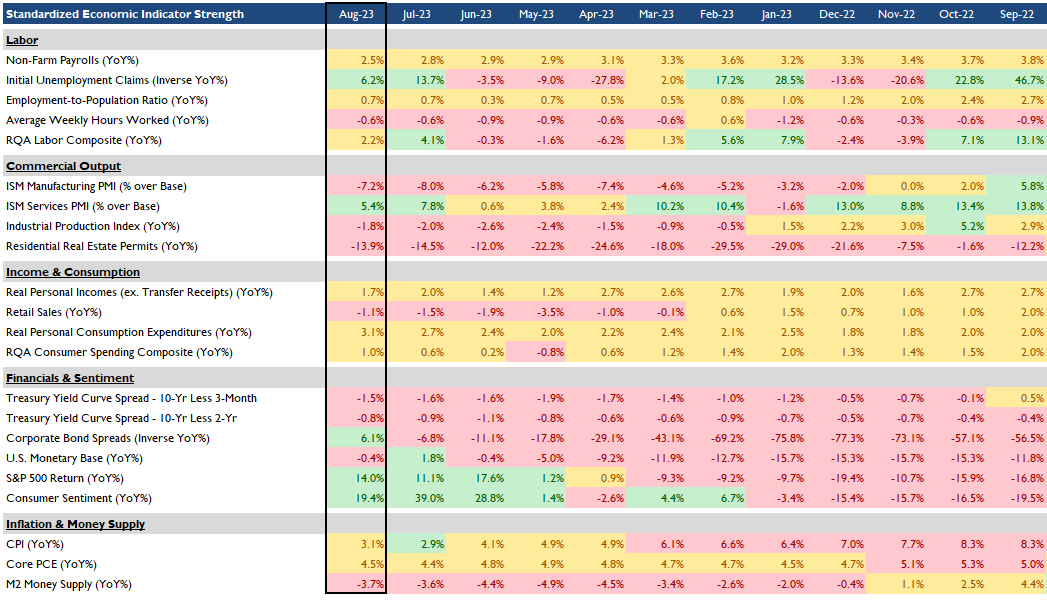
Source: Analysis by RQA. Data from U.S. Federal Reserve; Bureau of Labor Statistics; Norgate Premium Data; Institute for Supply Management
Continuing from the previous month, data related to U.S. labor, income, and service sector output maintains a robust stance, demonstrating resilience. Meanwhile, manufacturing and industrial production data show year-over-year declines, indicating a growing disparity between the growth in U.S. services and the production of tangible goods.
This divergence is further underscored by the performance of U.S. equity markets, which remain range-bound. Notably, the services sector, particularly mega-cap technology stocks, has driven this trend, while sectors more reliant on goods, such as basic materials and consumer staples, continue to lag behind. Additionally, annual changes in the Consumer Price Index (CPI) suggest a relatively stable inflation rate of around 3.5%. However, bond yields remain elevated due to the Federal Reserve's commitment to a "higher for longer" policy stance.
MARKET REGIME DISCUSSION
The Federal Reserve's decision to maintain interest rates at their current levels, while widely expected, was accompanied by a noticeably hawkish tone in their communication. Our growth model, though positive, still indicates a moderate level of growth in the near-term, suggesting that parts of the economy are struggling given the backdrop of higher interest rates.
The labor market continues to exhibit strength, with a robust job market, albeit with certain leading indicators showing signs of softening. As equity markets underwent corrections throughout the past month, the probability of a rate hike at the next Federal Reserve meeting has significantly diminished, moving from a roughly 50% chance a month ago to just 20% today.
Amid the backdrop of sustained positive inflation and a varied range of growth dynamics—from sluggish to moderately positive—we find ourselves situated within the stagflation and inflationary boom economic quadrants. It's worth noting that the Federal Reserve's commitment to its hawkish stance, while anticipated, underscores its dedication to monitoring inflation trends and influencing potential interest rate decisions. The intersection of unemployment data and inflation trends remains a focal point for both the Fed and market participants, significantly impacting considerations related to asset allocation.

Source: RQA.