

RQA Indicator Spotlight: Mind the Margins – The Engine Behind Market Valuations
Corporate profit margins — more than traditional valuation multiples — may be the real force keeping equity prices elevated. Forward P/Es and the CAPE ratio both point to overvaluation, yet the sustained profitability of hyperscalers is redefining what “expensive” means. By standard measures such as forward P/E, Shiller CAPE, or price-to-sales, U.S. equities look rich: the S&P 500 trades at a forward P/E above 22× versus a long-term norm of 16–18×, and the CAPE sits above 37×, a level last reached during the dot-com bubble.
Our own valuation work also signals stretched conditions and the prospect of below-average forward returns. Still, multiples alone don’t tell the whole story. Increasingly, the market’s focus is shifting from price to earnings — and, in particular, to the pace and durability of corporate profit margins.
Margins in Historical Context
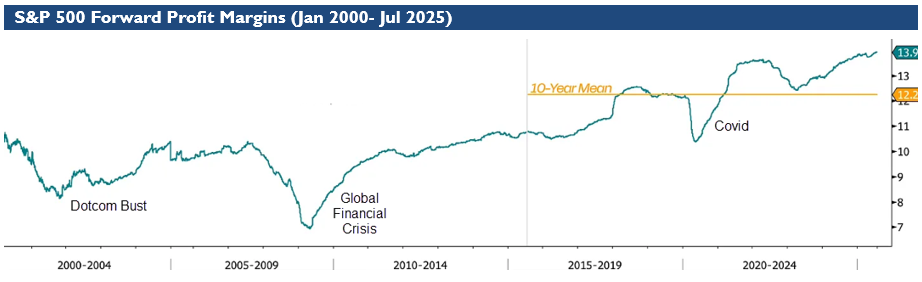
Over the past 25 years, S&P 500 net profit margins have experienced meaningful cycles — compressing during recessions like the Global Financial Crisis or COVID, then rebounding in recoveries. Historically, margins have tended to mean-revert due to competitive pressures, rising input costs, or regulatory changes.
Source: Duality Research, Bloomberg, & RQA.
Margins averaged 8–10% for decades. But in the last 10 years — and especially since 2020 — something has shifted. Today, forward profit margins hover over 13%, and the 10-year average has climbed to around 12%. This is a notable break from the historical range, and it helps explain why valuation ratios remain elevated, despite broader economic uncertainty.
What Changed? Tech Titans Became the Earnings Engine
The main driver of this margin expansion is the growing dominance of a small group of hyperscaler tech firms — Microsoft, Apple, Alphabet, Amazon, Meta, and NVIDIA. These companies operate with high fixed-cost leverage and low marginal costs. Together, they account for 30–35% of the S&P 500’s market cap and over 40% of the index’s profit growth. Their businesses are capital-efficient, globally scalable, and increasingly monetized via AI, cloud services, and platform ecosystems. Their margins often exceed 20%, and they continue to grow rapidly.
Perhaps most strikingly, the combined market capitalization of the top 7 tech companies is now equivalent to the bottom 432 companies in the S&P 500. That level of concentration has reshaped not just index weightings — but index-level profitability itself.
The Debate: Mean Reversion or Structural Shift?
This brings us to the central question for equity markets today: Will profit margins revert to historical norms, or are we in a new era of structurally elevated margins?
The case for reversion: Profit margins have always faced gravity. Rising wages, increasing competition, input costs, and potential AI commoditization could compress margins. There are also natural bounds — unless overall GDP begins accelerating in real terms, revenue and margin expansion will ultimately run into the law of large numbers.
The case for sustaining (or expanding): While “this time is different” is a dangerous phrase, there is genuine uncertainty about how transformative AI and next-gen tech could be. At RQA, we use LLMs and AI tools daily, and we see firsthand how they reduce operational friction and unlock scale. The largest tech firms are spending more than a billion dollars a day to push this frontier forward — the opportunity set is unique, to say the least. If AI-driven productivity gains are real and widespread, margins may not only hold — they may expand.
The Risk Dynamic: Why Margins Matter More Than Ever
As margin optimism drives valuations back toward extremes, the risk-reward dynamic becomes more asymmetric. If margins hold or rise, elevated valuations may prove justified — and returns could continue upward. But if margins compress even modestly — let alone revert fully — the downside for equity prices could be significant.
This is why investors and allocators need a framework that goes beyond just valuation multiples. We side with the need for a methodical, evidence-based approach that participates in upside, yet remains grounded and adaptable for a variety of macroeconomic outcomes.
Conclusion:
Looking backward, the data suggests U.S. equities are expensive. Looking forward, the real lever is corporate profitability, not just the price tag. If margins hold or grow, there may be justification for today’s valuations. If not, the correction could be sharp.
That’s the fundamental question going forward — and the reason we remain focused not just on where markets are, but on how they’re earning their way there.
Economic Forecast Model
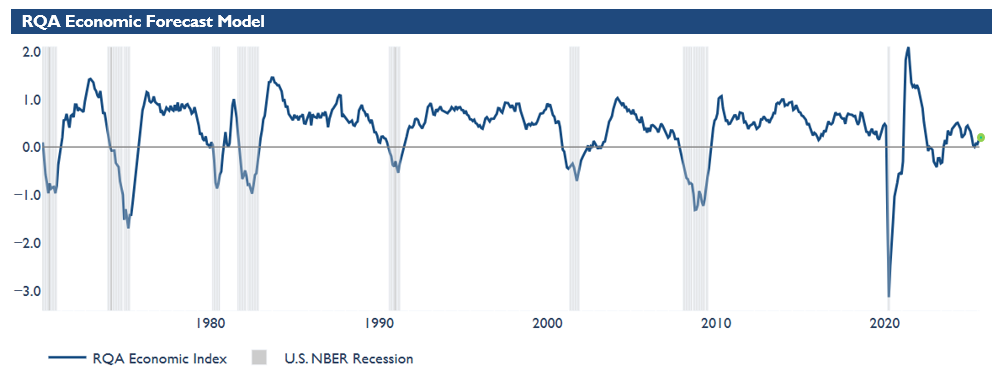
Year to date, the economic growth forecast model has gradually moderated, trending toward the zero bound—signaling continued sluggish growth in the near term. Recent data shows more of the same, with a modest rebound just above the zero line, indicating a fragile but positive shift.
This aligns with an environment marked by elevated uncertainty, ongoing strength in select high-growth areas, and a labor market that, while not particularly strong, has avoided a sharp deterioration. As we look ahead, we’ll continue to monitor year-end trends for further insight into the direction of the broader economy.
Source: Analysis by RQA. Data from U.S. Federal Reserve; Bureau of Labor Statistics; Norgate Premium Data; Institute for Supply Management.
The RQA Economic Forecast Model represents a consolidated composite of key economic leading indicators and market-based explanatory variables. The goal of this composite model is to present a holistic measure of primary U.S. economic growth drivers and their trends over time. (Additional detail on the model’s construction is provided here.)
Values above the zero-line are indicative of positive U.S. economic growth expectations in the near-term, and therefore, indicate economic strength and lesser chance of recessionary pressure. On the other hand, values below the zero-line represent the opposite - a more negative outlook and more elevated probabilities of the U.S. experiencing an economic contraction.
TAKING A CLOSER LOOK AT THE ECONOMIC DRIVERS
The RQA heat map of economic drivers provides additional insight into the U.S. growth outlook. By examining trends across sectors—such as labor, industrial activity, and financial conditions—we gain a more detailed understanding of the economy's health and trajectory. This breakdown helps us anticipate potential shifts in growth expectations and inflation trends.

Source: Analysis by RQA. Data from U.S. Federal Reserve; Bureau of Labor Statistics; Norgate Premium Data; Institute for Supply Management.
As of July 2025, U.S. economic indicators show a mixed but stabilizing landscape, with growth cooling from last year’s highs yet no sharp decline signaling recession. Consumer metrics remain resilient, and financial conditions are normalizing.
The labor market shows a modest rebound, with the RQA Labor Composite at 1.7% YoY in July after prior declines. However, July’s jobs report added only 73,000 jobs, with downward revisions and rising long-term unemployment signaling softening. Non-farm payrolls grew 0.7% YoY, but fewer layoffs (improved unemployment claims) temper concerns. Markets now expect a 50-basis-point rate cut by September, with a terminal rate near 3%.
Commercial output is soft: manufacturing PMI is -2.0%, services PMI dipped to 1.6% above base, industrial production is flat (0.0% YoY), and residential permits contract mildly (-3.4% YoY).
Income and consumption are steady but slowing. The RQA Consumer Spending Composite is 0.7% YoY, down from 1.5%, though real personal income growth (3.6% YoY) supports spending despite retail sales dipping -0.4% YoY. Financials are mixed: the 10y–2y yield curve spread is 0.4%, corporate spreads are stable, and S&P 500 returns hold at 14.8% YoY, but consumer sentiment remains cautious at -6.9% YoY.
Inflation is near target, with CPI at 2.7% YoY (up from May’s 2.3%) and Core PCE at 2.9% YoY. M2 money supply growth at 4.7% YoY supports liquidity without fueling excess inflation. These trends suggest a balanced environment, giving policymakers room for measured adjustments.
MARKET REGIME DISCUSSION
After a period of elevated uncertainty and negative market sentiment, conditions have begun to ease. Sentiment has rebounded modestly on hopes that the economy can withstand the shocks endured earlier in the year. As earnings season unfolds, early results are cautiously optimistic—though geopolitical headline risks remain front and center. Growth forecasts within our framework continue to ebb and flow, but have recently stabilized and moved away from prior negative territory. Meanwhile, inflationary concerns tied to tariffs, while anticipated, have not yet shown up materially in the data.
Policy Pivot in Motion
The Federal Reserve held rates steady at its July meeting, but the tone is shifting. Several Fed officials, including Minneapolis Fed President Neel Kashkari, have voiced openness to a rate cut in September, particularly if labor and inflation trends continue to soften. For the first time in over three decades, dissent emerged within the FOMC, with two members favoring a rate cut. In addition to the data, political pressure is increasingly influencing the Fed as policymakers face scrutiny over maintaining restrictive policy amid signs of slowing economic momentum.
Labor Market: Softening, Not Cracking
The July jobs report disappointed, with just 73,000 jobs added and recent downward revisions to prior months. Long-term unemployment is rising, and job openings have continued to narrow. Despite this, current labor conditions are not deteriorating rapidly. The market's interpretation has leaned dovish, accelerating expectations of a rate cut—potentially 50 basis points—by September, with several banks forecasting a terminal rate near 3%.
Resilient Markets Shake Off Soft Data
Equity markets have remained firm despite mixed macro data. The S&P 500 has returned to positive territory for the year, driven by strong tech earnings and persistent optimism around AI-led innovation. The resolution of certain tariff disputes and fading of prior year shocks have helped risk assets regain footing. Although market breadth remains narrow, overall risk sentiment has improved meaningfully.
While some tariffs have been rolled back, newly proposed “Liberation Day” tariffs and intensifying political rhetoric have reintroduced trade uncertainty. For now, markets have largely shrugged off these developments, but underlying concerns about stagflation and global supply chain disruptions remain—particularly as the U.S. moves closer to election season.
Economic Quadrant and Regime Update
Our updated regime framework reflects a continued transition. The RQA Forecast Model recently bounced off the zero line and has moved moderately back into positive territory. While growth remains sluggish, this shift suggests near-term momentum has stabilized and avoided a deeper downturn. On the inflation side, the data show a minor uptick, but no meaningful reacceleration. Tariff-driven inflationary pressures have yet to materialize but remain a key risk to monitor.
Taken together, the environment remains fragile. Investors are navigating a backdrop of low but steady growth, inflation still above trend, and rising policy and geopolitical risks.

Source: RQA.