

RQA Indicator Spotlight: Federal Funds Rate
In this month’s economic data spotlight, we take a look at the Federal Funds Rate (the “Fed Funds Rate”), recent changes in interest rates, and the implied forward rates determined by the futures markets.
Shifts and trends within the Fed Funds Rate have a large impact on the broader economy and the general cost of financing. By definition, the Fed Funds Rate is the interest rate at which depository institutions (such as banks and credit unions) lend reserve balances to other depository institutions overnight on an uncollateralized basis. It is set by the U.S. Federal Reserve (the “Fed”) as part of its monetary policy to influence the economy by controlling the money supply and interest rates.
Changes in the Fed Funds Rate have a significant impact on borrowing costs for consumers and businesses, affecting spending, investment, and inflation. As such, it has been one of the key tools used by the Fed to achieve its dual mandate of promoting stable prices (i.e., controlling inflation) and maximizing sustainable levels of employment in the U.S.
As the Fed continues to balance its two mandates of full employment and seeking a target level of inflation (roughly 2% over the long-term), the last couple of years has marked one of the largest and fastest increases in the Fed Funds Rate in its history.
Due to inflationary conditions in the last two years, the Fed has increased the Fed Funds Rate from nearly zero to over 5% since the current rate hike cycle began in early 2022. While the Fed paused on further rate hikes at its June meeting, this month they resumed with another 25bp increase, bringing the current Fed Funds Rate to 5.5%, a level not seen since the early 2000s.
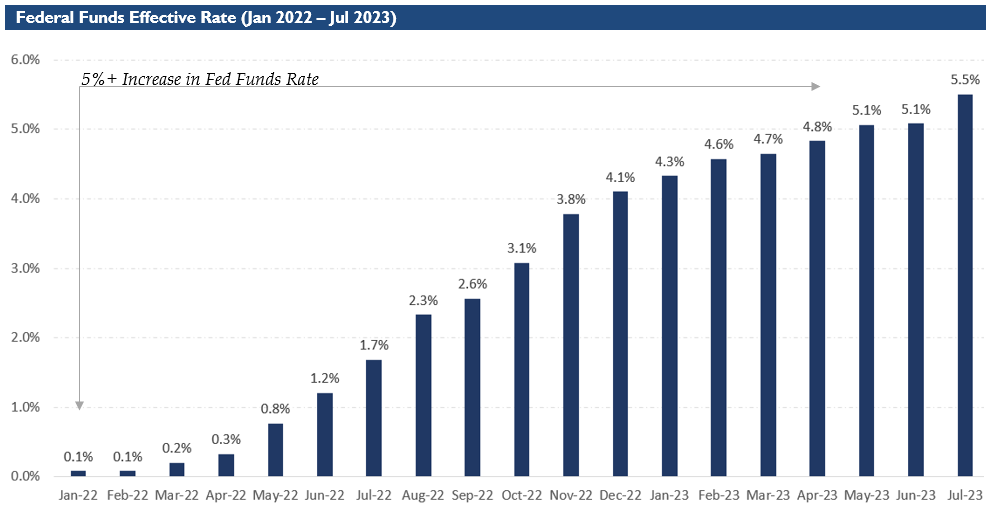
Source: Data from FRED.
Looking forward, we can use the futures market to gauge where rates are expected to be over the next 6-8 months. Per the snapshot below, we can note the uptick in the near-term, followed by a leveling off, and then eventual decline in the early months of next year. While the Fed provides their guidance in terms of future interest rates, they also remain data dependent, which is another way of saying: “we will wait and see what the data suggests about economic conditions, inflation, and unemployment conditions and then react accordingly.”

Source: Analysis by RQA. Data from CME Group.
Overall, while many market participants have suggested the Fed needs to slow the rate increases within the rate hiking cycle, strength within the labor market along with some “green shoots” within a number of leading economic indicators have given confidence to the Fed in regards to its view on the strength of the U.S. economy - and therefore, they reiterated their stance on interest rates of “higher for longer”.
As the Fed Funds Rate remains elevated and forecasted to increase in the near-term, the focus remains on the ongoing implications of higher financing costs to various U.S. sectors - particularly as higher rates tend to slow business activity and put overhead pressure on corporate fundamentals. Consequently, market participants are constantly wanting to know when the Fed will ultimately pause this rate hiking cycle.
Economic Forecast Model
For the data set ending in June, the RQA Economic Forecast Model shifted into positive territory for the first time since turning negative in July 2022 – landing at a new reading of 0.02 (up from last month’s level of -0.32).
As we noted in our last’s months discussion regarding the S&P Index as a forecasting tool, having the economic forecast model fall in alignment with the leading indicator data set is imperative to provide confidence in the expected U.S. economic growth profile over the intermediate-term. While this reading remains modest and very close to the model’s zero line (i.e., “no growth”), it is the first positive reading in over a year, which provides us with some renewed optimism (albeit cautious optimism) in regards to U.S. economic fundamental growth.

Source: Analysis by RQA. Data from U.S. Federal Reserve; Bureau of Labor Statistics; Norgate Premium Data; Institute for Supply Management
The RQA Economic Forecast Model represents a consolidated composite of key economic leading indicators and market-based explanatory variables. The goal of this composite model is to present a holistic measure of primary U.S. economic growth drivers and their trends over time. (Additional detail on the model’s construction is provided here.)
Values above the zero-line are indicative of positive U.S. economic growth expectations in the near-term, and therefore, indicate economic strength and lesser chance of recessionary pressure. On the other hand, values below the zero-line represent the opposite - a more negative outlook and more elevated probabilities of the U.S. experiencing an economic contraction.
TAKING A CLOSER LOOK AT THE ECONOMIC DRIVERS
In the economic heatmap below, we are able to peak under the hood at a wide mix of underlying growth drivers in the U.S. economy. By reviewing this underlying data in more detail, we are better able to see how the underlying components of the U.S. economic growth picture are behaving through time. The indicators presented below have each proven to have predictive qualities in estimating the future direction of U.S. economic growth.
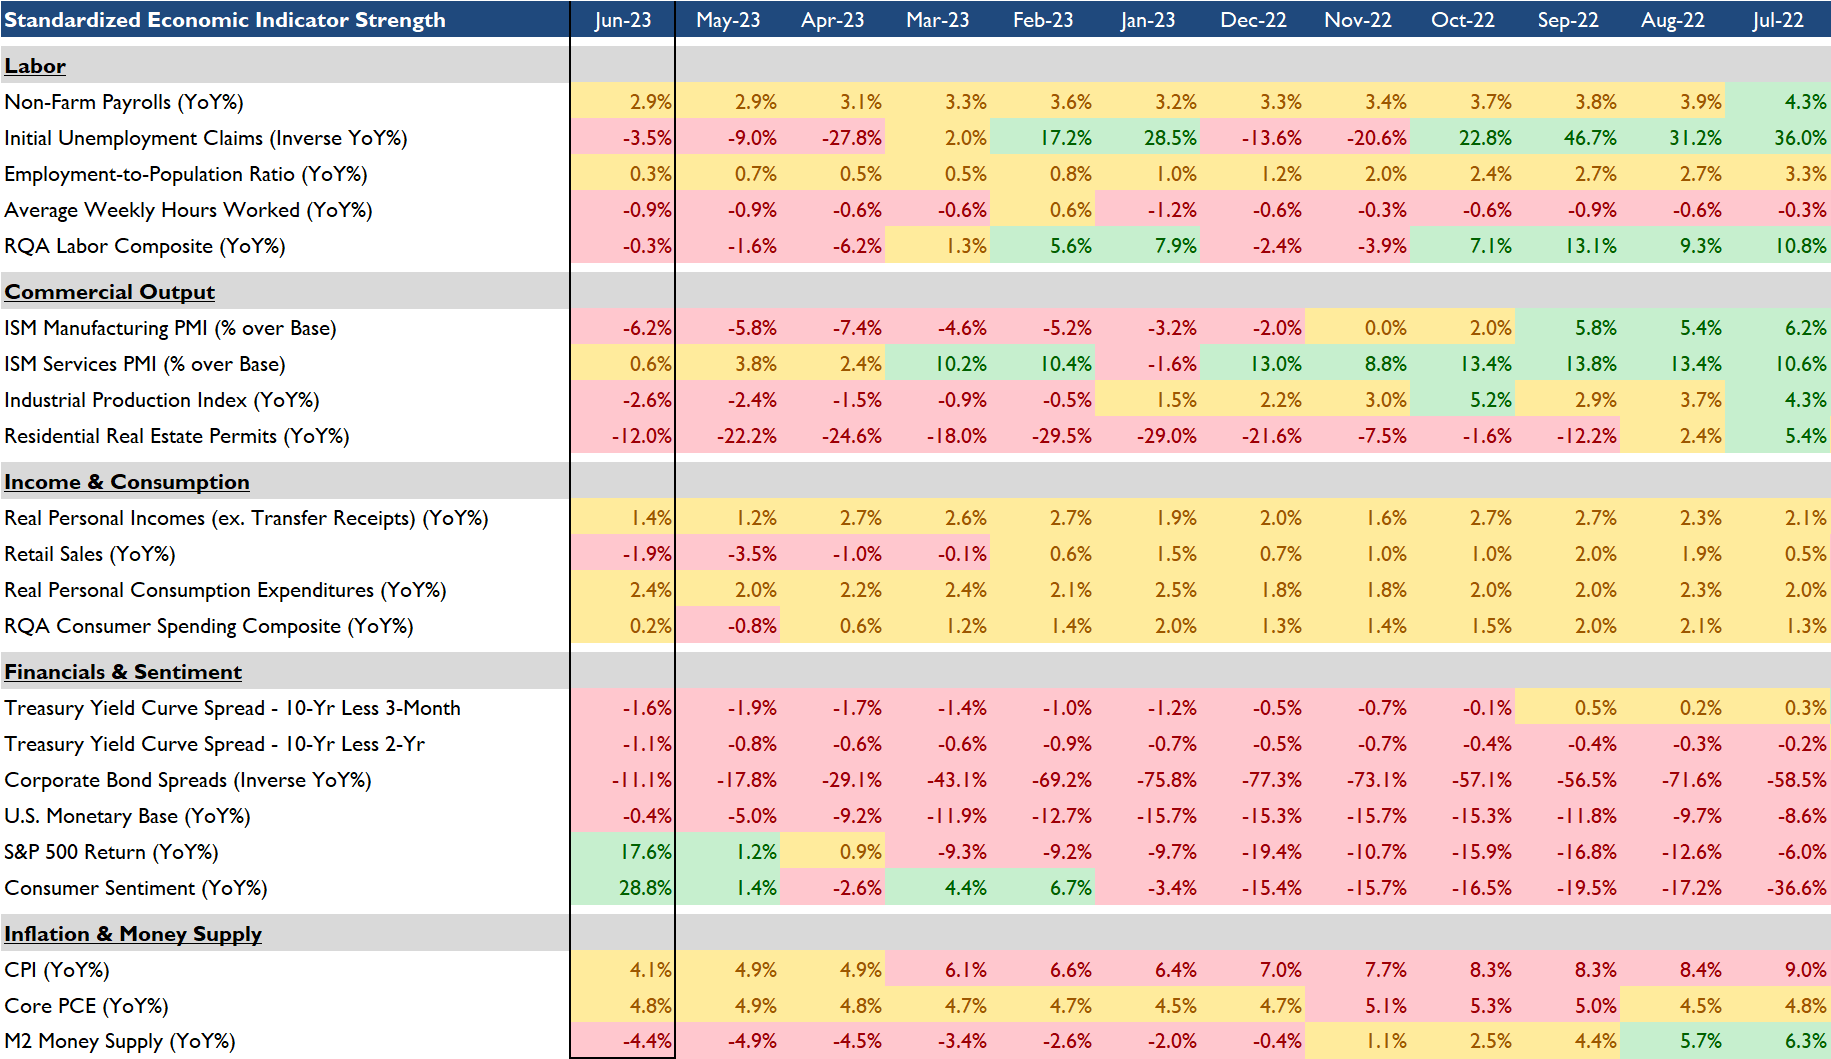
Source: Analysis by RQA. Data from U.S. Federal Reserve; Bureau of Labor Statistics; Norgate Premium Data; Institute for Supply Management
In reviewing the data reported through June, we have started to see some robust developments on the growth side in terms of improving rate of change figures throughout a number of the leading indicator sets. We can note the following:
The U.S. stock market (S&P 500) continues to register year-over-year strength, which historically has proven to be a positive forecast for economic growth in the near-to-medium term;
Consumer sentiment, consumer spending, real personal incomes, and services sector PMI data points are now all trending higher, yet retail sales continue to lag and trend lower;
Labor market data, while lower year-over-year, continues to hold up in absolute terms, despite recent news of layoffs across a number of sectors; and
Financial market indicators, excluding the aforementioned S&P 500, remain fairly pessimistic, as yield curves remain inverted and corporate bond spreads remain elevated.
MARKET REGIME DISCUSSION
Given persistently elevated inflation levels and the robust labor market, the Fed increased the Fed Funds Rate this month, bringing the headline range to 5.25-5.50%. Per our Indicator Spotlight discussion above, market expectations are for an additional hike or two later this year, followed by a pause and eventual reduction early next year.
So far, inflationary data has softened to be more within reach of long-term expectations, relieving the Fed of any substantial pressure to continue an aggressive rate hiking policy in the near term. With that said, it does appear from the forward looking data that rates will be in the higher-for-longer camp.
From a market regime estimation standpoint, we find it encouraging that our internal economic forecast model has shifted back into positive territory - and if this new upward move continues, we could be looking at a slight shift in market regime expectations. More specifically, we could be moving out of the stagflationary quadrant and into an environment more characteristic of an inflationary boom, as illustrated below. That being said, we don’t believe we are necessarily out of the woods just yet, as the economic leading indicators we track remain very much on the dividing line. Overall, the composite economic forecast model has flipped to the upside (slightly), which provides some glimmers of optimism for fundamental U.S. economic growth going forward.

Source: RQA.