

RQA Indicator Spotlight: Consumer Sentiment
In this month’s data snapshot, we take a brief look at sentiment data, how its derived, and what implications it may have in helping us determine where we are in the market cycle.
The U.S. Michigan Consumer Sentiment Index is a survey conducted by the University of Michigan that assesses consumers on three areas. These survey areas include: i) how the consumer views the prospect of their own financial situation; ii) how the consumer views the prospects for the general economy in the near-term; and iii) how the consumer views the prospects for the general economy in the long-term. The survey, which is conducted on a monthly basis, asks 50 core questions that track different aspects of consumer attitudes and expectations.
Set forth below is a historical data set for the sentiment index going back over 40 years. The index oscillates around its long term average of 85, with readings above the average representing consumer optimism and readings below the average representing consumer pessimism as it relates to their financial well being and their view of the broader economy.

In general, sentiment data is helpful within the financial community because it provides a look into how the consumer is fairing in the current economic climate. More specifically, if we generally pay attention to the overall trend in sentiment data, we can analyze when consumers are content and general outlooks are improving - and this can be a positive sign that consumers and their overall consumption will continue in the current environment. In contrast, a downward trending sentiment index can provide warning signs indicating the consumer is concerned about future economic conditions, and as a result, may be transitioning to a more conservative fiscal stance.
Another key item to note is that sentiment data can be helpful in marking extremes in market conditions, as well. During times of excessive optimism, consumer sentiment readings can reach local extremes and help identify when consumers and markets in general are overly exuberant. This is when the sentiment data set can act as a contrarian signal, as the extreme sentiment can mark a top in consumption and financial conditions. The same is true during times of economic crisis, where consumer sentiment can reach near-term lows and can help mark when things are just about to turn back up.
The graphic detailed below identifies the local extremes in the sentiment data and displays the forward return in the S&P 500 over the following 12 months. We can note when sentiment is at elevated extremes, forward returns are largely lower than when sentiment is reaching historic lows.
Just like most insights derived from economic data points, no single indicator is perfect, but the aggregate helps paint a good picture of where the economy sits from a growth vs. contraction standpoint - and often time these indicators can help identify turning points at extremes.

When taking a look at where the index sits today, we can note historically low levels in sentiment driven by concerns over rampant inflation and a Federal Reserve that is quickly tightening monetary conditions. While this extreme pessimism within consumer sentiment may act as a contrarian signal, it’s still a bit premature, as these types of readings can fluctuate a bit before the overall trend changes course.
Economic Forecast Model
As we head into the final two months of the year, the RQA Economic Forecast Model remains steady around the zero bound, forecasting little to no economic growth in the near-to-intermediate term. More specifically, the economic model (which represents a measure of standard deviation around the zero-growth line) at the end of October was -0.02.

The RQA Economic Forecast Model represents a consolidated composite of key economic leading indicators and market-based explanatory variables. The goal of this composite model is to present a holistic measure of primary U.S. economic growth drivers and their trends over time. (Additional detail on the model’s construction is provided here.)
Values above the zero-line are indicative of positive U.S. economic growth expectations in the near-term, and therefore, indicate economic strength and lesser chance of recessionary pressure. On the other hand, values below the zero-line represent the opposite - a more negative outlook and more elevated probabilities of the U.S. experiencing an economic contraction.
TAKING A CLOSER LOOK AT THE ECONOMIC DRIVERS
In the economic heatmap below, we are able to peak under the hood at a wide mix of underlying growth drivers in the U.S. economy. By reviewing this underlying data in more detail, we are better able to see how the underlying components of the U.S. economic growth picture are behaving through time. The indicators presented below have each proven to have predictive qualities in estimating the future direction of U.S. economic growth.
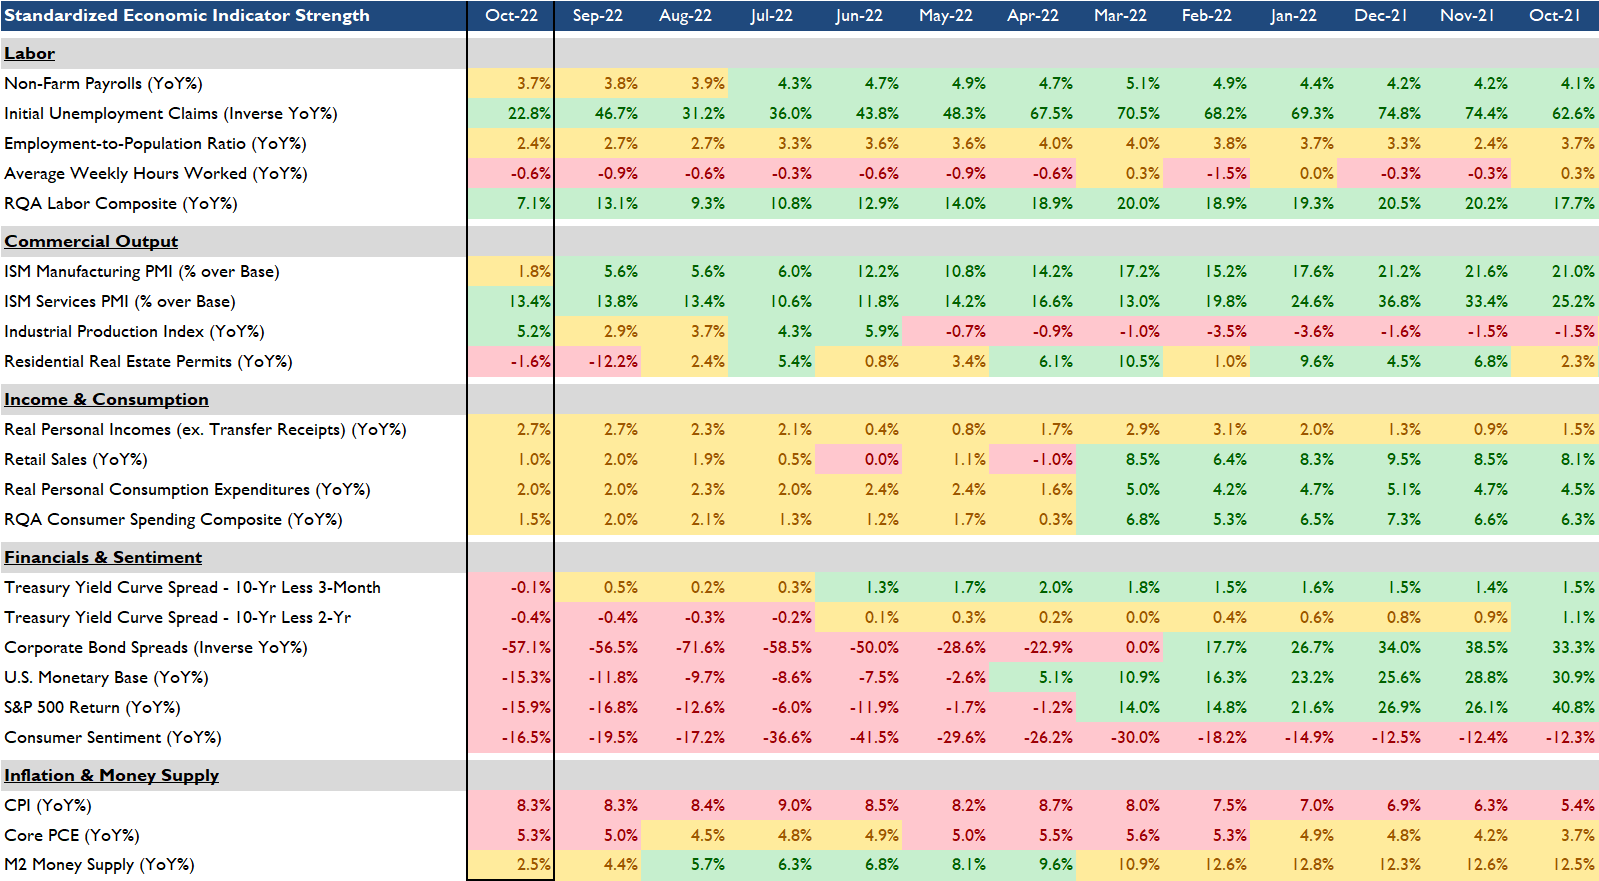
October data showed some strength in Commercial Output while exhibiting continued deterioration in leading data within Financials & Sentiment and Inflation & Monetary Supply. While ISM Manufacturing continued its positive trend, ISM Services has started to show signs of a modest slowdown in its growth profile.
Within the Financial & Sentiment data set, per the data spotlight above, the year-over-year change in the sentiment index remains negative - albeit coming off recent lows. The 10-Year less 3-Month Treasury spread ticked negative in the month, as short-term interests rates continue to rise vs. long-term rates.
MARKET REGIME DISCUSSION
October inflation data came in slightly lower than expected with a year-over-year CPI print of 7.7%. Given the lack of any meaningful growth in the leading economic indicator set, we find ourselves hovering between inflationary boom (top right quadrant) and stagflation (top left quadrant).
If the Federal Reserve can achieve a reduction in inflationary pressure without pushing the economy into a contraction, we would expect to see the model shift more towards the top right quadrant - though there certainly remains some work for the indicator set to shift in that direction. We can note, as the dollar takes a breather, the asset classes in the top two quadrants have experienced an uptick from fairly depressed levels. As we move forward, monitoring U.S. dollar strength along with forward inflation expectations will be key in determining shifts across regime asset classes.
