

RQA Indicator Spotlight: U.S. LABOR Market
In this month’s economic data spotlight, we take a closer look at the U.S. labor market, key drivers, and what the recent trends could be signaling about the near-term economic outlook. As we have discussed in previous updates, U.S. unemployment is a key area of focus, as it is one of the Federal Reserve’s ("the Fed’s”) dual mandates, along with maintaining a reasonable level of annual inflation, which is targeted at 2.0%. As such, understanding current labor market drivers and trends can provide some potential insight into how the Fed might act going forward as it relates to changes in interest rates and monetary policy.
From our view, a softening or weakening labor market could signal a slow down or even a reversal in interest rate hikes. On the other hand, if U.S. labor markets continue to show signs of robustness, this can add to the confidence of Fed officials that the economy remains resilient and interest rate hikes will likely continue.
Set forth below is the most recent data for U.S. non-farm payrolls (“payrolls”), which historically has acted as one of the primary datasets relied on by the Fed in their assessment of the U.S. labor market. We can note that payrolls continue to show year-over-year increases in the 3-4% range, which indicates a fair amount of continued strength. Moreover, given the backdrop of Fed tightening and recent layoffs within the tech sector, year-over-year payroll growth at these levels continues to be a surprise to the upside for many market participants.
That being said, the pace of growth in the last six to eight months appears to be in decline, with overall year-over-year growth declining to 3.4% in November from a more recent high of 5.1% in March of this year. In summary, overall headline growth remains fairly consistent for payrolls, but general short-term trends in the rate of that growth appear to be shifting.

Another key indicator and dataset for the U.S. labor market is initial unemployment claims (“initial claims”), which represent individuals who are newly registering for unemployment benefits. In our research, initial claims data generally acts as a strong predictor of a weakening labor market.
Throughout most of 2021 and this year, initial claims had been showing substantial year-over-year declines, which can be seen more clearly in the graph below. These steep declines in initial unemployment claims (i.e., more people moving away from government assistance) were primarily attributable to the return to more normal conditions following the unprecedented amount of unemployment and government assistance that was produced from COVID-related lock downs. As quarantine measures were alleviated and people went back to work, the amount of people seeking government unemployment benefits dropped precipitously.
As we fast forward to the last six months, however, the rate of unemployment claims versus a year ago has been trending higher, with November data showing an increase of over 20%. While there is some noise within these data series, the short-term trend within initial claims can be an early indicator of general weakness within the overall U.S. labor market landscape.

In general, the headline figures for both non-farm payrolls and initial claims continue to remain fairly robust given how far the U.S. economy is within the current rate hike cycle. It’s important we keep an eye on the data detailed above, however, as recent growth trends within these core datasets are starting to show some signs of softening. If this softness continues, it will be more challenging for the Fed to continue the current rate hike cycle, and a potential pause or pivot will become more likely.
Economic Forecast Model
Heading into the last month of 2022, the RQA Economic Forecast Model dropped more decisively below the zero line, indicating more of a cautionary warning around prospective economic growth in the near-to-intermediate term. More specifically, the economic model (which represents a measure of standard deviation around the zero-growth line) at the end of November was -0.30.
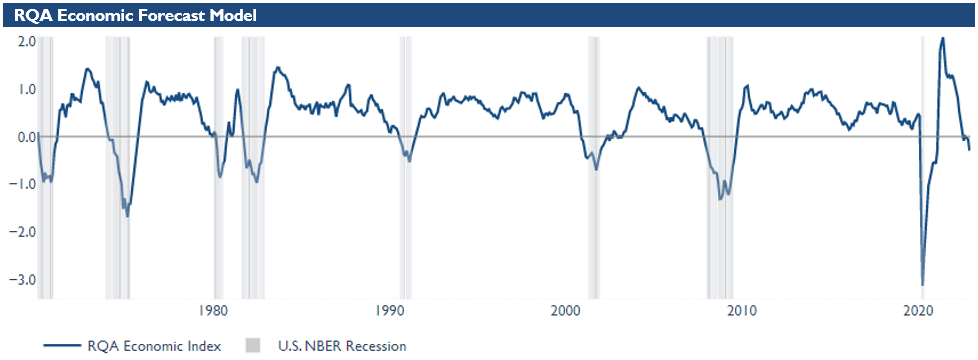
The RQA Economic Forecast Model represents a consolidated composite of key economic leading indicators and market-based explanatory variables. The goal of this composite model is to present a holistic measure of primary U.S. economic growth drivers and their trends over time. (Additional detail on the model’s construction is provided here.)
Values above the zero-line are indicative of positive U.S. economic growth expectations in the near-term, and therefore, indicate economic strength and lesser chance of recessionary pressure. On the other hand, values below the zero-line represent the opposite - a more negative outlook and more elevated probabilities of the U.S. experiencing an economic contraction.
TAKING A CLOSER LOOK AT THE ECONOMIC DRIVERS
In the economic heatmap below, we are able to peak under the hood at a wide mix of underlying growth drivers in the U.S. economy. By reviewing this underlying data in more detail, we are better able to see how the underlying components of the U.S. economic growth picture are behaving through time. The indicators presented below have each proven to have predictive qualities in estimating the future direction of U.S. economic growth.

To start with the positives, the data that was reported up through the end of November showed that consumer spending and personal incomes continued to trend modestly higher. Additionally, industrial production and PMI indicators are continuing to show year-over-year growth, but we are beginning to see some degradation in the upward momentum of these figures.
On the more negative side, we continue to witness warning signs across all financial and sentiment indicators tracked by our models, and new residential real estate building permits continue to experience weakness and indicate potential intermediate-term softness in the U.S. real estate markets. In addition, as discussed in the data spotlight above, the U.S. labor market is beginning to show some potential softness within its recent trends. More specifically, the latest year-over-year readings in initial claims have started to trend higher in recent months, indicating that the Fed’s policies against inflation might be having an impact on U.S. employment.
MARKET REGIME DISCUSSION
Annual inflation as indicated by year-over-year CPI through November was reported at 7.7% (and the latest CPI data reported this month at 7.1%), indicating inflation levels remain far above the Fed’s target of 2.0%. Moreover, the recent decline in U.S. economic fundamentals per the aggregated explanatory variables we track indicates that we may be heading more decisively into a “stagflationary” regime (top left quadrant), as opposed to an inflationary boom environment (top right quadrant).
As leading economic indicators show signs of a softening economy, the recent actions by the Fed of slowing the amount of rate hikes were met with a relief rally in broader risk assets. As data continues to be digested and the market discounts forward recessionary probabilities, the big question remains: has the Fed over-tightened, leading to lower future earnings, or are additional hikes necessary to choke off inflationary pressures? Monitoring drivers of both forecasted growth and inflation will continue to help shape portfolio positioning in the near and intermediate-term.
