

RQA Indicator Spotlight: Fed “Pivots”
In this month’s economic data spotlight, we take a look at historical interest rates, specifically the Federal Funds Rate, and what the potential end of rate hiking cycles, or Federal Reserve “pivots”, may imply for the outlook of the economy and risk assets in the U.S.
As we enter 2023 with a mixed economic backdrop and a persistently elevated level of inflation, the key topic front and center continues to be discussions around when the Fed will slow or stop interest rate increases, or even potentially reduce interest rates. Given the historic declines in global fixed income markets in 2022, monetary conditions have continued to tighten. As liquidity left the system, we witnessed a sharp spike in the U.S. Dollar, while risk assets repriced lower with higher flying growth equity and longer-dated fixed income feeling the brunt of the correction.
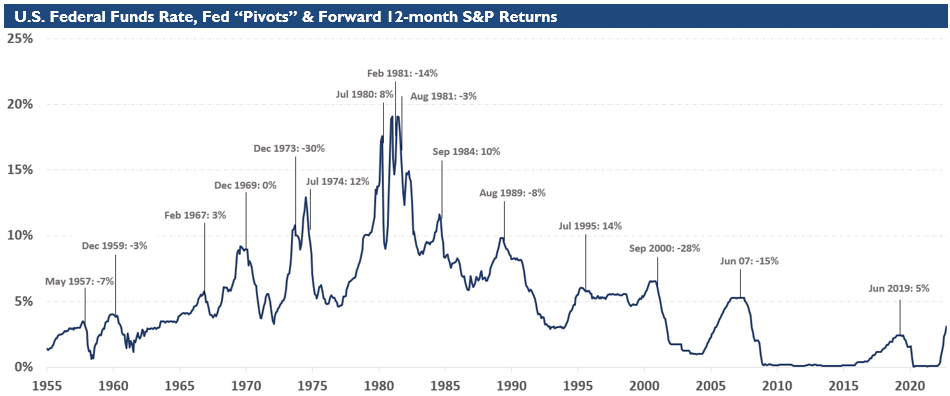
With one of the fastest and sharpest rate hike cycles potentially nearing an end, the broader market is looking forward to an ease in monetary conditions and perhaps a sustained rally in risk seeking assets. While this is an intuitive approach to take, we can review prior Fed pivots, or pauses in their previous interest rate hike cycles, and see what that has meant for economic and market performance in the months that followed. The chart detailed below displays historical interest rate levels, the month/year of historical Fed pivots, and official U.S. NBER Recessions.

In the pivot analysis, we have identified 15 occurrences where the Federal Funds Rate remained flat or declined after increasing over a multi-year period, and we overlayed this with official U.S. NBER Recessions. The red arrows identify pivot points that ultimately led to recessions. Using the liquidity framework, one could argue that the Fed generally hikes too much and for too long, and by the time they decide to pivot, the economy is already overly stressed and poised to enter a recession. It’s not a perfect indicator of recession, however, as there are a few occurrences where a pause or decline in the rate cycle did not trigger or precede a recessionary event.
So what does this mean for the stock market in general over the intermediate-term? In the next graphic we take take a look at the same Fed pivot points and then measure the 12-month forward return of the market (using the S&P500) following the date of the pivot.
What’s interesting to see is that forward returns for the S&P are lower when looking forward one year from most Fed pivots. This lower return outcome is consistent with the above recession overlay, as it suggests risk assets may not be pricing in the full impact of the most recent rate hikes on broader economic growth. To illustrate this further, the following chart details the pivot dates, the S&P500 forward 12-month return, and both averages for all 12-month return periods and 12-month return averages after a Fed pivot.

In reviewing the data, the average 12-month return after a Fed pivot was -4% (vs. the base rate average of all 12-month periods of 9%). The Fed pivot marked the start of significant corrections in Dec ‘73, Feb ‘81, Sep ‘00 and Jun ‘07, where forward returns were lower by more than 10%. It’s important to also point out, however, that there were a handful of years where the forward return met or exceeded the market average over the 12-month look-forward window.
In conclusion, investors rooting for the Fed to change course in favor of looser monetary conditions is likely: i) very short-sighted, as they are hoping for a near-term bounce; or 2) very long-sighted, as easier monetary conditions and lower rates will likely take more than a year to have a material impact on economic growth and market upside performance. For the intermediate-term, however, the data shows that Fed pivots tend to precede periods of economic contraction and softening market conditions, as opposed to inflection points that give rise to upward trending markets.
As usual, these data sets are general tools that help gauge current market headwinds, tailwinds, and future expected outcomes. Can the U.S. economy and risk assets see a material bounce following a pivot in central bank interest rate hikes? Absolutely. But, do we think this is the base case? Not likely based on the historical data set.
Economic Forecast Model
As we kick of 2023, the RQA Economic Forecast Model continues to suggest growth is moderating and potentially contracting in the U.S. economy. The economic model (which represents a measure of standard deviation around the zero-growth line) at the end of December was -0.37.

The RQA Economic Forecast Model represents a consolidated composite of key economic leading indicators and market-based explanatory variables. The goal of this composite model is to present a holistic measure of primary U.S. economic growth drivers and their trends over time. (Additional detail on the model’s construction is provided here.)
Values above the zero-line are indicative of positive U.S. economic growth expectations in the near-term, and therefore, indicate economic strength and lesser chance of recessionary pressure. On the other hand, values below the zero-line represent the opposite - a more negative outlook and more elevated probabilities of the U.S. experiencing an economic contraction.
TAKING A CLOSER LOOK AT THE ECONOMIC DRIVERS
In the economic heatmap below, we are able to peak under the hood at a wide mix of underlying growth drivers in the U.S. economy. By reviewing this underlying data in more detail, we are better able to see how the underlying components of the U.S. economic growth picture are behaving through time. The indicators presented below have each proven to have predictive qualities in estimating the future direction of U.S. economic growth.

In general, the trends in labor data continue to be mixed, as growth in non-farm payrolls and employment-to-population ratios remain relatively strong, but small cracks are beginning to appear in initial unemployment claims - albeit they are coming off fairly healthy levels. When putting it all together, moderately strong labor conditions continue to be the main takeaway for now - but keeping an eye on unemployment figures and payrolls in coming months will be key, as it looks like some more meaningful shifts in momentum might be transpiring.
Within the commercial output category, manufacturing data ticked lower, while services PMI has remained on trend. Residential real estate permits continue their significant decline, as higher rates have frozen activity in the sector, and Income & Consumption categories showed little movement versus last month.
Reviewing Financial & Sentiment categories, most indicators sit at the recent lows, which implies a fairly severe level of stress across the board. Yield curves remain inverted, credit spreads remain stretched, and while sentiment has improved slightly, it remains fairly depressed, as well.
MARKET REGIME DISCUSSION
Annual inflation as indicated by year-over-year CPI recorded 7.1% last month (and coming in at 6.5% in the most recent data series), remains elevated and far above the Fed’s target of 2.0%, but is starting to see some moderation in its recent trend. The sustained elevated inflation level coupled with the softer outlook for U.S. economic fundamentals per the explanatory variables detailed above points to a “stagflationary” regime (top left quadrant), as opposed to an inflationary boom environment (top right quadrant).
As inflation data continues to moderate, attention will be on the level of interest rate hikes going forward. If the Fed hints at a reduction in the level of future rate hikes, markets and risk assets will likely welcome the so called easing. With that said, and per the pivot analysis above, the question remains - is the economy strong enough to stem off a contraction in the next 12-18 months? A renewed focus on corporate earnings and leading indicators within the labor market will help paint the picture.
