RQA Indicator Spotlight: PMI Data
In this month’s economic data spotlight, we take a look at the ISM Purchasing Managers Index (“PMI”) data for both U.S. manufacturing and services sectors.
PMI data points are released each month by the Institute for Supply Management (“ISM”), and they represent an average composite measure, or diffusion index, of various survey responses provided by supply executives in both manufacturing and services sectors. More specifically, the surveys conducted ask the supply executive participants to gauge activity in a number of key areas, like new orders, inventories, backlog, and production - and these sub-indices are then combined to create the respective PMI readings. Ultimately, a PMI above 50 indicates an overall expansion of the manufacturing or services economy, whereas a PMI below 50 signifies a contraction.


As depicted in the charts above, the PMI data released through January 2023 now has both the manufacturing and services PMI readings below 50, indicating near-term signs of contraction in fundamental business activity. Historically, per the data above, as PMI measures contract below the 50 level for a significant period of time, recessionary events typically followed (illustrated by the grey shading within the charts).
It’s important to note, however, that these indicators have a tendency to bounce around more than other leading indicators, so their near-term indications should be used more as a supplementary or confirmatory signal as part of a more robust forecasting measure. That being said, we can use these indicators to gain further insights into what recent business activity and near-term expectations might be from company executives on the front lines, especially when taking both manufacturing and services PMI readings into account.
Economic Forecast Model
As of February 2023, the RQA Economic Forecast Model continues to indicate that growth is moderating and potentially contracting in the U.S. economy. The economic model (which represents a measure of standard deviation around the zero-growth line) at the end of January was -0.41.

The RQA Economic Forecast Model represents a consolidated composite of key economic leading indicators and market-based explanatory variables. The goal of this composite model is to present a holistic measure of primary U.S. economic growth drivers and their trends over time. (Additional detail on the model’s construction is provided here.)
Values above the zero-line are indicative of positive U.S. economic growth expectations in the near-term, and therefore, indicate economic strength and lesser chance of recessionary pressure. On the other hand, values below the zero-line represent the opposite - a more negative outlook and more elevated probabilities of the U.S. experiencing an economic contraction.
TAKING A CLOSER LOOK AT THE ECONOMIC DRIVERS
In the economic heatmap below, we are able to peak under the hood at a wide mix of underlying growth drivers in the U.S. economy. By reviewing this underlying data in more detail, we are better able to see how the underlying components of the U.S. economic growth picture are behaving through time. The indicators presented below have each proven to have predictive qualities in estimating the future direction of U.S. economic growth.

At the top of our list, U.S. labor market indicators bounced back fairly meaningfully in January, particularly as initial unemployment claims were reported far lower than expected - and even showed improvement over the same period last year. Moreover, non-farm payrolls and the employment-to-population ratio remain in relatively healthy growth trends, especially considering the interest rate environment, adding to the overall picture of robustness and resiliency in the U.S. labor market. On the back of the strong labor market conditions, it is not a total surprise that our Income & Consumption categories showed little change in their trends, as wages remain strong while financial market conditions continue to experience volatility.
On the contrary, commercial output figures have continued to weaken in recent months. Per the data snapshot above, manufacturing and services PMI data ticked below their base index levels of 50, with services PMI now showing an overall contraction. In addition, industrial production figures show a loss of momentum along with a residential real estate permits that have continued their year-over-year declines, as higher rates have hampered activity in the sector.
Finally, in reviewing our Financial & Sentiment categories, the lion’s share of our indicators remain near their lows and in year-over-year down trends, implying continued stress across asset markets. Additionally, key treasury yield curve spreads remained inverted and credit spreads remain stretched, indicating heightened levels of anticipated risks from bond investors.
MARKET REGIME DISCUSSION
Annual inflation as indicated by year-over-year CPI came in at 6.5% last month (and 6.4% in the most recent data series). These levels remain elevated in the eyes of the Fed, particularly relative to their target of 2.0%; however, we are certainly continuing to trend in the right direction, coming off levels near 9.0% back in June of 2022.
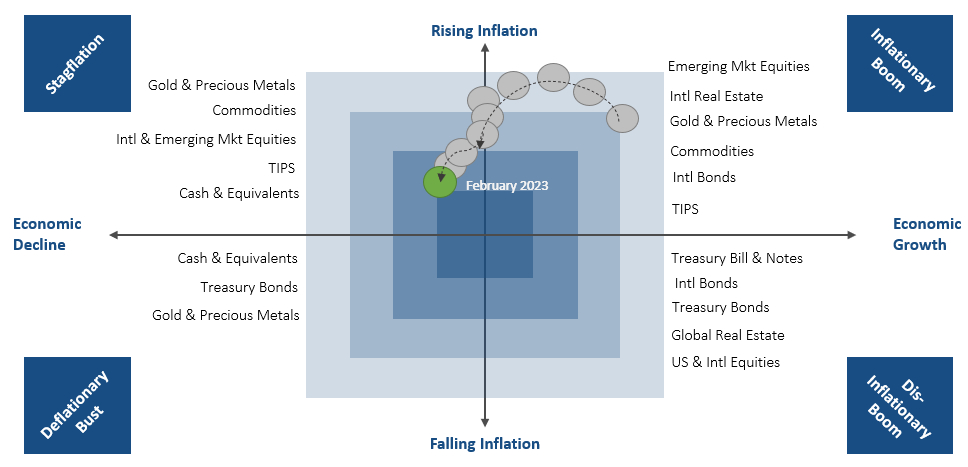
From a market regime perspective, with CPI levels remaining fairly elevated and above target, and as more fundamental growth leading indicators continue to point toward contraction, we remain focused on operating within a “stagflationary” regime (top left quadrant), as opposed to an inflationary boom environment (top right quadrant). As we have discussed previously, the ongoing robustness within the labor market will help shape the soft vs. hard landing narrative in the months to come.
At the end of the day, there are a number of variables at play on the margin here, as continued attention will be on the Fed’s decisions around keeping rates elevated. In our view, if CPI levels continue their trend lower, the Fed will eventually have to turn their attention back to the health and resiliency of U.S. economic growth, particularly given the recent weakness showing up across many of the data sets discussed above. The question is: will the Fed view U.S. inflation as meaningfully under control before rate conditions push the fundamental economy to the brink of recession? If we are going to be “higher for longer” from a rates perspective, the stress will likely continue to build on the economic growth side.