

RQA Indicator Spotlight: U.S. LABOR Market Update
All eyes are centered on the U.S. labor market after January and February readings around Non-Farm Payrolls and Initial Unemployment Claims pointed toward continued strength across the U.S. labor force. Moreover, while there have been some mixed signals in prior months for specific labor data trends (as noted in the December Update), on an absolute basis, jobs data continues to point to a robust growth picture for the U.S. economy.
The resilience of U.S. labor conditions likely provides the Fed with additional conviction toward further and more substantial rate hikes. This was the general market viewpoint until just last week, when major disruptions within the U.S. and global banking system came to the forefront. Investors are now looking beyond indications of economic strength, with more of their focus going toward the potential knock-on effects related to the weakness within the banking system.

Source: Analysis by RQA. Data from FRED.
As referenced above, a lot has transpired in the last couple weeks, as abrupt issues at a number of U.S. and global banks caused major concerns around global financial system stability - and many of the root causes of these issues stemmed from the break-neck pace of Fed interest rate hikes over the past year.
Give these latest dynamics, the market’s expectations around near-term interest rate hikes have spanned a wide range. For instance, just last week the Fed Chairman, Jay Powell, suggested “the ultimate level of interest rates is likely to be higher than previously anticipated”, which many attributed to the continued strength and resilience in labor market trends. The market then reacted quickly with the implied probability of a 50 basis point rate hike at the March meeting increasing to 68%, as compared to a mere 15% one month prior. (The market had previously priced in a smaller, 25 basis point hike.)
But, given the latest dynamics within the banking sector, the expected change in the federal funds rate has already shifted back to a more conservative 25 basis point level. This reflects just how much the tide has shifted from a hot labor market in support of higher rates to banking system fragility leading to Federal Reserve backstops and a shift lower in rate hike expectations.
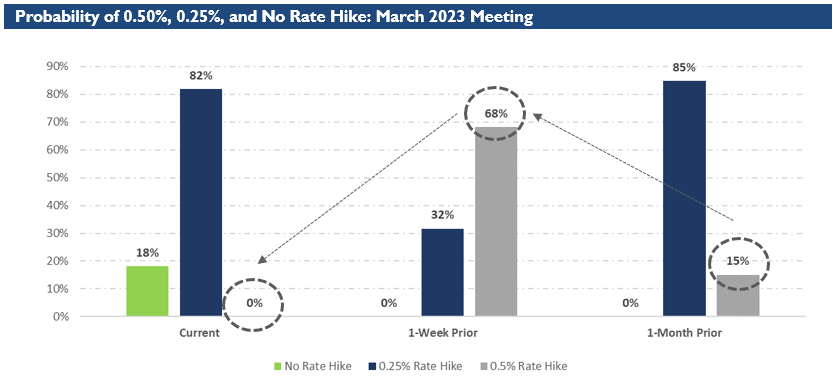
Source: Analysis by RQA. Data from CME Group.
What does this mean? Well, the Fed will likely continue to use the strong labor data as a sign the economy remains “hot”, and as a result, will likely justify pushing rates up higher for longer. With issues surmounting in the banking system, however, pressure to reduce or stop rate hikes altogether (or at least for now) will start climbing as financial conditions deteriorate.
In general, it’s a murky landscape, as the strong labor data is countered by a whole host of other economic datapoints, including the most recent bank failures, that suggest growth in the U.S. economy is cooling off or even declining. These dichotomies are not new to the markets, and yet they always pose a vexing problem for investors as they occur. In our experience, ignoring the headlines and adhering to data-oriented decision making without bias is the best way to navigate these changing landscapes.
Economic Forecast Model
Checking on the RQA Economic Forecast Model for the month of March, the model measured at -0.24 (vs. February reading of -0.41). While the uptick is notable, the overall forecast remains below the zero bound which suggests the broader economy is sputtering or on the verge of slowing. A shift into positive territory would indicate a more robust outlook for growth in the next few quarters.

Source: Analysis by RQA. Data from U.S. Federal Reserve; Bureau of Labor Statistics; Norgate Premium Data; Institute for Supply Management
The RQA Economic Forecast Model represents a consolidated composite of key economic leading indicators and market-based explanatory variables. The goal of this composite model is to present a holistic measure of primary U.S. economic growth drivers and their trends over time. (Additional detail on the model’s construction is provided here.)
Values above the zero-line are indicative of positive U.S. economic growth expectations in the near-term, and therefore, indicate economic strength and lesser chance of recessionary pressure. On the other hand, values below the zero-line represent the opposite - a more negative outlook and more elevated probabilities of the U.S. experiencing an economic contraction.
TAKING A CLOSER LOOK AT THE ECONOMIC DRIVERS
In the economic heatmap below, we are able to peak under the hood at a wide mix of underlying growth drivers in the U.S. economy. By reviewing this underlying data in more detail, we are better able to see how the underlying components of the U.S. economic growth picture are behaving through time. The indicators presented below have each proven to have predictive qualities in estimating the future direction of U.S. economic growth.

Source: Analysis by RQA. Data from U.S. Federal Reserve; Bureau of Labor Statistics; Norgate Premium Data; Institute for Supply Management
In reviewing the data reported through February, the key positive takeaways in regards to economic fundamental health are the continued strength across U.S. labor markets, a solid rebound in ISM Services PMI data, and a glimmer of upside peaking through in reported consumer sentiment. In addition, our broader category for Income & Consumption data remains resilient and continues to show modest year-over-year upward trends.
On the negative side, Commercial Output data around tangible goods continues to face headwinds, as evidenced by negative ISM Manufacturing PMI readings along with year-over-year declines in industrial production and new residential building permits. Moreover, CPI readings continue to remain frustratingly elevated, while financial market indicators remain deeply negative - most notably the persistent inversion on the U.S. treasury curve, which indicates that bond market participants remain extremely cautious about economic health in coming months.
MARKET REGIME DISCUSSION
Overall declines in the level of inflation over the past four months have helped paint the picture of a soft landing leading to a repricing higher for risk assets. Recently, however, this narrative has started to stall, given the reflation of some commodity measures and the aforementioned strength in the labor market. Given these latest inflationary dynamics, shifting interest rate expectations are now putting a damper on risk assets once again, as the Fed continues to exude their hawkish rhetoric.
Given elevated CPI growth levels and the of lack positive growth indications from the economic model, economic positioning within the quadrant framework remains in the “stagflationary” regime (top left quadrant). Asset classes of focus for this quadrant include Gold, Commodities, International Equity, TIPS, and Cash.

Source: RQA.