RQA Indicator Spotlight: Labor, Inflation, and Rate Hikes
Through the end of August 2022, we felt it would be prudent to highlight two key data points that are central to what’s going on in today’s market environment - inflation and U.S. labor trends. Not to mention, these data points are of particular interest to the U.S. Federal Reserve in guiding their ongoing policy decisions, as they follow a dual mandate of effectively controlling inflation and maintaining a strong U.S. labor market.
First, we will focus on the year-over-year percent changes in the Consumer Price Index (CPI) - in other words, the rate of inflation. As illustrated below, the latest CPI data reported up through August produced an annual inflation rate of roughly 8.5% (and as of yesterday (9/13/2022) the latest inflation reading is 8.3%), which are levels not seen in the U.S. since the inflationary periods of the 1970s and 1980s. These faster-than-usual price increases in the U.S. economy have put the Fed on alert, and as a result, they have been hiking interest rates at a pace not witnessed in decades.

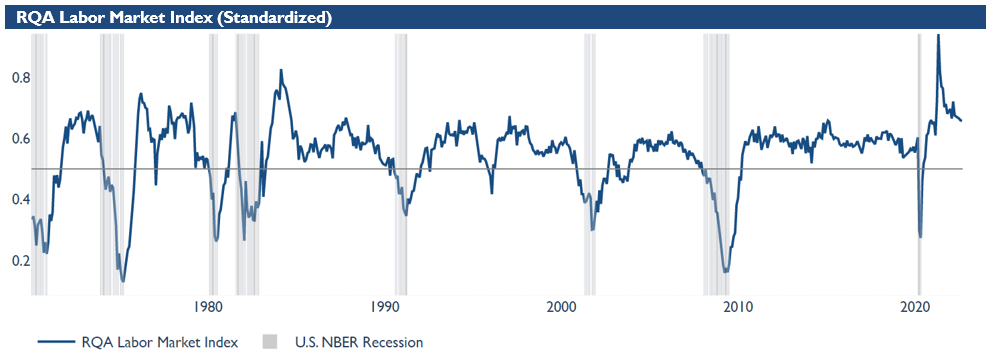
We then turn to our second key data point, a measure of U.S. labor market strength. To assess the U.S. labor market overall, we have created the RQA Labor Market Index, which seeks to measure aggregate labor market growth and robustness through a variety of data points, including levels of unemployment, non-farm payrolls, average weekly hours worked, and labor force participation rates.
Per the standardized RQA Labor Market Index below, a measure above 0.50 suggests overall health within the labor market, whereas a measure below 0.50 suggests weakness across the aggregate labor market. The current reading of 0.66 suggests the U.S. labor market remains robust and in a strong position.
It is important to note, however, that even though the index most recently appears to be in a downward trend, the primary cause of this near-term down-draft has more to do with labor market trends stabilizing after an extreme post-pandemic upward swing. At current levels, the index is still presenting a U.S. labor market that looks to be strong and resilient, at least for the near-to-intermediate future.
So, what are the economic implications going forward? In our view, it is this persistent labor market strength that continues to act as the Fed’s backstop support in their fight against inflation. Essentially, as long as the labor market remains robust and inflation remains elevated, we believe the Fed will continue their rate hikes until either labor or inflation begins to breakdown. This of course is a delicate balancing act with many potential knock-on effects to the market and the economy at large.
Economic Forecast Model
As presented below, we are continuing to see a degradation in growth momentum across a number of major economic and market-based leading indicators - and as of the end of August, the aggregate economic model measure has now officially entered negative territory, which historically has been highly predictive of U.S.-based economic recessions in the near-to-intermediate term.
More specifically, the model at the end of August dropped to -0.09. This figure represents a measure of standard deviation around the zero-growth line, and this latest reading continues to indicate a more mixed economic picture in the near-term with now a slight bias towards negative growth.
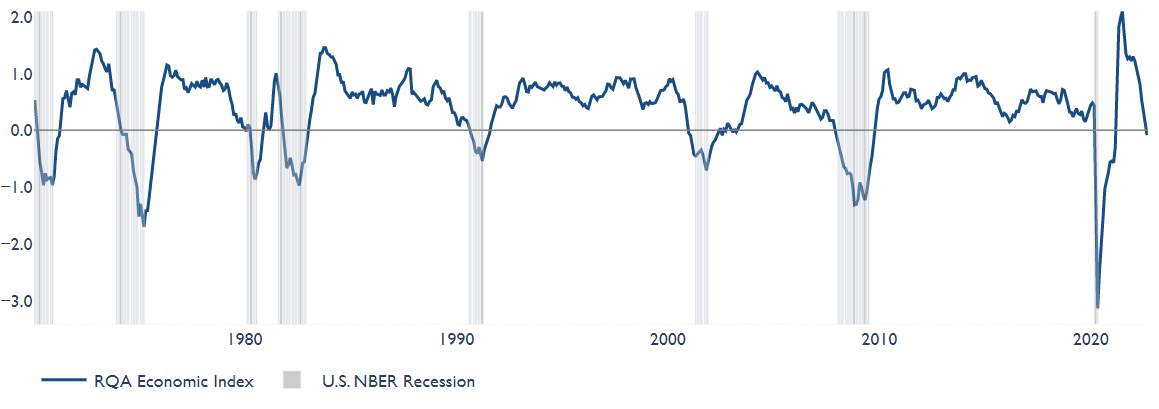
The RQA Economic Forecast Model represents a consolidated composite of key economic leading indicators and market-based explanatory variables. The goal of this composite model is to present a holistic measure of primary U.S. economic growth drivers and their trends over time. (Additional detail on the model’s construction is provided here.)
Values above the zero-line are indicative of positive U.S. economic growth expectations in the near-term, and therefore, indicate economic strength and lesser chance of recessionary pressure. On the other hand, values below the zero-line represent the opposite - a more negative outlook and more elevated probabilities of the U.S. experiencing an economic contraction.
TAKING A CLOSER LOOK AT THE ECONOMIC DRIVERS
In the economic heatmap below, we are able to peak under the hood at a wide mix of underlying growth drivers in the U.S. economy. By reviewing this underlying data in more detail, we are better able to see how the underlying components of the U.S. economic growth picture are behaving through time. It is important to note that the indicators presented below have each proven to have predictive qualities in estimating the future direction of U.S. economic growth.

As we can see above, the economic growth profile remains fairly mixed, and is now even showing signs of increased degradation. On the positive side, commercial output figures continue to exhibit strength, and as noted above, the labor market seems to be strong and resilient, at least for the time being. Moreover, U.S. income and consumption figures remain positive in their year-over-year growth trends; however, these figures appear to be struggling to maintain their positive momentum in recent months.
On the more negative side, financial and investor sentiment data continue to flash warning signs, as elevated inflation levels are driving concerns of continually rising rates and more hawkish policy decisions from the Federal Reserve and U.S. Treasury in the near-to-intermediate term.
MARKET REGIME DISCUSSION
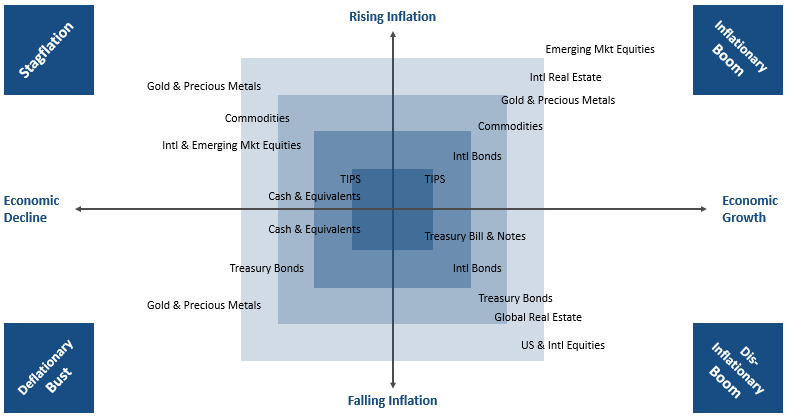
Given the latest trends in inflation and economic forecast data, it is our expectation that the near-term U.S. market environment will most likely resemble a “stagflationary” regime, unless near-term economic growth and market-based variables begin to rebound.
In these types of environments, it has historically been advantageous to tilt portfolio exposures toward asset classes that have return profiles less reliant on strong economic growth, while also maintaining structural characteristics that assist in preserving value during periods of rising inflation.
We can use the regime diagram below to help us identify more optimal assets given the anticipated growth and inflation dynamics over the near-to-intermediate future - and in this current environment, we would tend to lean more toward the top two quadrants. Additionally, due to recent trends towards stagflation, it is our expectation that fundamental pressures will lean more favorably toward precious metals, commodities, and international assets.