

RQA Indicator Spotlight: Yield Curve Inversion
As of the end of July, the markets witnessed a notorious phenomenon known as a yield curve inversion. Yield curve inversions occur when shorter-term treasury yields rise above the yields on longer-term treasuries. In this case, as depicted above, the yield on the 2-year note (3.3%) is now higher than the yield on the 10-year note (2.8%), representing one of the larger yield curve inversions in recent history.
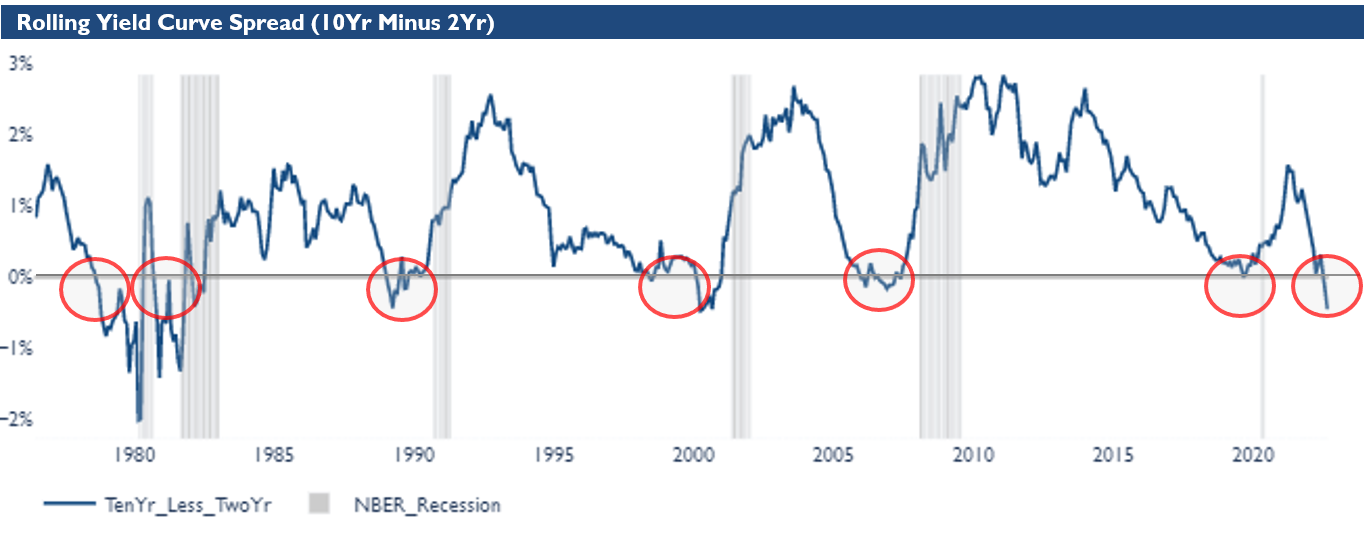
Yield curve inversions are “notorious” due to their track record of forecasting impending U.S. recessions, as they have occurred prior to nearly every major recession in recent history – albeit its signaling generally tends to be a bit early.
You might be wondering: Why does an inverted yield curve have any forecasting abilities at all? Well, one of the primary theories is that bond market participants (and the investing crowd in general) are becoming more risk averse in their outlook on the economy - and so they are choosing to buy longer-dated treasuries to protect their capital and lock in longer-term risk-free rates.
This buying of longer-term treasuries pushes the prices on these bonds higher and their yields lower. Ultimately, these yields get pushed below the yields on their short-term counterparts (i.e. 2-year notes), and then there you have it - the yield curve becomes inverted.
It’s not so much that the yield curve inversion itself is predicting a recession, but more of the prevailing outlook of all the market participants. As we’ve noted before (here), the wisdom of the crowds is an extremely powerful phenomenon, and that is exactly what is happening beneath the surface of the yield curve inversion - the crowd is voting that longer-term risk-free instruments are preferable to shorter-term instruments, as they believe trouble might be on the horizon.
Economic Growth Trends & Forecast
Per RQA’s Economic Forecast Model depicted below, we are continuing to see a degradation in growth momentum across a number of major economic and market-based leading indicators.
More specifically, the model at the end of July sat at 0.20 (which represents a measure of standard deviation above or below the zero-growth line), indicating a more mixed economic picture in the near term - albeit with a slight bias towards continued positive growth.

The RQA Economic Forecast Model represents a consolidated composite of key economic leading indicators and market-based explanatory variables. The goal of this composite model is to present a holistic measure of primary U.S. economic growth drivers and their trends over time. (Additional detail on the model’s construction is provided here.)
Values above the zero-line are indicative of positive U.S. economic growth expectations in the near-term, and therefore, indicate economic strength and lesser chance of recessionary pressure. On the other hand, values below the zero-line represent the opposite - a more negative outlook and more elevated probabilities of the U.S. experiencing an economic contraction.
TAKING A CLOSER LOOK AT THE ECONOMIC DRIVERS
In the economic heatmap below, we are able to better understand the underlying growth drivers in the economy and see which pieces are ebbing and flowing through the recent market environment.
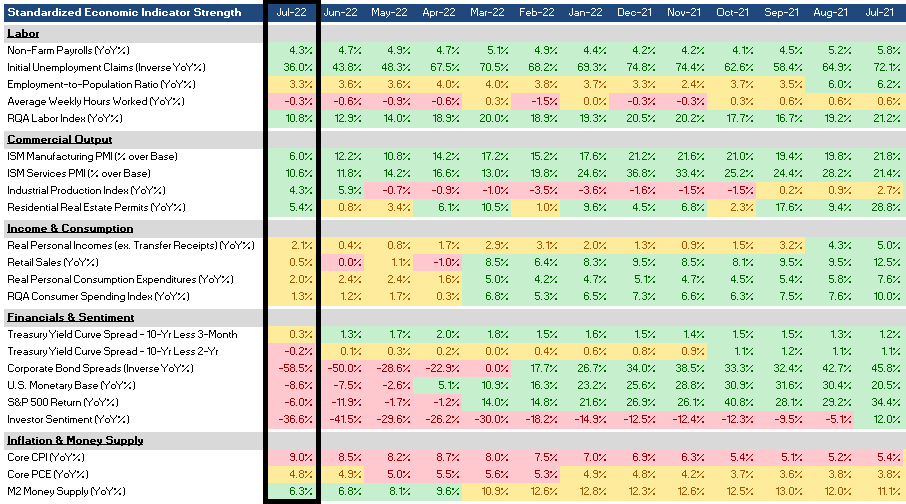
As illustrated above, we can see that the economic growth profile is fairly mixed, as commercial output figures measuring industrial and services production remain relatively strong. Moreover, the labor market seems to be maintaining its resiliency - and following suit, U.S. income and consumption figures remain positive in their year-over-year growth trends. That being said, income and consumption figures have lost some momentum in recent months, and numerous financial and investor sentiment data points are flashing warning signs, while inflation figures are running at rates not seen since the 1980s.
Market Regime DISCUSSION
Given the latest trends in inflation and economic forecast data, it is our expectation that the near-term U.S. market environment will most likely resemble a “stagflationary” regime - or potentially an inflationary boom regime, if economic fundamental momentum stays in positive territory.
In these types of environments, it has historically been advantageous to tilt portfolio exposures toward asset classes that have return profiles less reliant on strong economic growth, while also maintaining structural characteristics that assist in preserving value during periods of rising inflation. We can use the regime diagram below to help us identify more optimal assets given the anticipated growth and inflation dynamics over the near-to-intermediate future - and in this current environment, we would tend to lean more toward the top two quadrants. Moreover, due to recent trends, it is our expectation that fundamental pressures will lean more favorably toward precious metals, commodities, and international assets.

Disclaimer: All information, analyses, and research contained herein is for informational purposes only and is not: i) for trading or investing purposes, or ii) a solicitation to offer investment advice or services.
All opinions expressed are as of the date of publication and subject to change. RQA and its affiliates are not liable for the accuracy, usefulness or availability of any such information or liable for any trading or investing based on such information.
Investing in financial markets involves a substantial degree of risk. There can be no assurance that any investment objectives described herein will be achieved. Investment losses may occur, and investors could lose some or all of their investment. No guarantee or representation is made that any strategy, Analysis, or investment program, including, without limitation, its investment objectives, diversification strategies, or risk monitoring goals, will be successful, and investment results may vary substantially over time. Nothing herein is intended to imply that any investment methodology may be considered "conservative", "safe", "risk free" or "risk averse".
The RQA Economic Index (the “Index”) is a proprietary index created by Richmond Quantitative Advisors, LLC (“RQA”). The Index is not an investable product. It represents an aggregation of various economic data points and leading indicators, including economic output, economic activity, and employment indicators, along with a number of other fundamental and market-based data and explanatory variables. All indicators employed in the Index are unadjusted and based on first-release data points as provided by the sources listed above. All data adjustments posted following the first release dates are ignored for data integrity purposes and the goal of eliminating hindsight biases in the Index and across RQA’s economic forecasting efforts. (Note: Only data used in the Index is unadjusted and based on first-release data points. All other data and charts depicted above may or may not be adjusted based on post-dated reconciling adjustments from the data source providers or their affiliates.) The Index is designed to track varying degrees of fundamental growth within the U.S. economy by analyzing recent trends in the reported data. When investing, there are multiple factors to consider. The RQA Economic Index should not be used as the sole determining factor for investment-related decisions. Additionally, there is no guarantee that the Index will produce the same predictive results or recessionary warnings in the future, and the construction and methodologies behind the Index may be subject to change.
This presentation is for information purposes only and should not be used or considered as financial advice.