

Key Summary & Findings
Using the “wisdom of crowds” approach to combine multiple momentum strategies into a single portfolio increases returns, reduces risk, and improves diversification.
Deploying multiple momentum strategies eliminates the risk associated with single strategy selection and the potential for over allocation to an “unlucky” strategy.
The use of multiple momentum strategies allows for a more accurate representation of historical performance statistics by reducing the bias of just selecting the “best” backtest.
Investing in all momentum strategies (referenced as a Momentum Ensemble), as opposed to a single strategy, consistently performs in the top quartile of all momentum strategies.
Historically, the Momentum Ensemble and each momentum strategy individually dominate an equal weight portfolio on a total return and risk-adjusted return basis.
Introduction
In past RQA Insights on Momentum and Trend Following, we explored example investment strategies that took advantage of the momentum factor. As a brief recap, trend and momentum-oriented investment strategies are some of the most well-researched and widely documented phenomena observed across global markets through vast periods of market history. This style of investing seeks to profit from the autocorrelated nature of asset price returns over intermediate time intervals - i.e. assets that have gone up typically continue to go up, and muted or negative returns tend to beget further underperformance over the following weeks and months. As this is not a newly discovered market phenomenon, there are many asset managers and institutions that successfully use momentum tools to seek out higher absolute returns and improve diversification across their portfolios - and like these managers, we at RQA view momentum as a valuable component in certain areas of our strategy toolbox, as well.
In what follows, we will explore ways to enhance a basic momentum approach to building a global portfolio. Specifically, we will deploy the concept of the “wisdom of the crowds” by combining multiple momentum strategies into a single investment portfolio. We will explore the benefits of choosing multiple strategies by comparing the overall performance to a basic momentum strategy and traditional buy-and-hold approaches. As we will show, the historical performance would have been materially improved, particularly in terms of incremental risk-adjusted returns and overall portfolio diversification benefits over time.
The Wisdom Within the Crowds
The basic theory behind the “wisdom of the crowds”, as made popular by James Surowiecki’s book titled as such, is that “a diverse set of independently deciding individuals is likely to make certain types of decisions and predictions better than individuals or even experts”. In other words, a crowd of individuals all guessing or voting on a certain outcome is typically a lot more accurate than any individual person or domain expert. A classic example of this concept can be taken from an experiment performed by Francis Galton in 1906. During a trip to the local fair, a crowd made up of experts and non-experts was asked to guess the weight of an ox. Francis, determined to illustrate that the crowd had no more insight compared to the experts, decided to tally up the average prediction and determine its accuracy to the actual weight of the ox. To his surprise, the crowd’s average estimate of 1,197 pounds was within one pound of the actual weight of the ox - an overall estimate that easily outperformed any of the individuals, regardless of expertise.
Since the famous example involving the ox, numerous experiments have taken place, including the also popular jelly bean experiment more recently conducted by Michael Mauboussin at NYU. In this experiment, a jar of jelly beans takes the place of the ox, but as expected, the results were just as valid - the wisdom within the crowd (or his classroom of students) came out on top. More recent examples of the application of the wisdom of crowds falls within the area of data science and machine learning, where the combination of multiple machine learning model outputs can be tallied up as votes and used to help increase the accuracy of the estimation or forecast at hand – whether it be the weight of an ox, number of jelly beans, or in our case at RQA, an optimal portfolio of investments.
Recapping the Basic Concepts of Momentum
Before we get to the wisdom of the crowds concepts in terms of investment strategies, we will recap a basic approach to investing known as a momentum. As noted above, the thesis behind momentum is that asset price returns have been observed to be autocorrelated over time (in other words, they tend to trend), particularly over short-to-intermediate term time horizons (i.e. a few weeks to several months). The fundamental reasons behind this phenomenon are debated, but it is our view that a combination of psychological and behavioral biases paired with positive reinforcement in market fundamentals are typically at play. For example, strengthening asset fundamentals like revenues, earnings, market positioning, etc. often act as the initial catalysts for producing positive investment returns. Then, the simple fact that prices are rising typically drives investors to take further interest (often igniting a fear of missing out or “FOMO” response), driving further buying pressure from investors. This phenomenon can then surprisingly in turn benefit the asset’s underlying fundamentals, as higher stock prices can create better terms with lenders, improve negotiations with suppliers and customers, and provide companies with more ammunition for strategic acquisitions, driving further return momentum and even more robust investor conviction. George Soros in his book The Alchemy of Finance refers to this dynamic as “reflexivity”, where two separate and seemingly unrelated return drivers create a positive feedback loop, driving returns higher or lower depending on the directional bias of the self-reinforcing drivers. These reflexive processes have been observed countless times throughout history across multiple markets, asset classes, and investment strategies – and as a result, momentum and trend-like behavior within markets ensues.
An Initial Momentum Approach
In order to deploy the wisdom of crowds to our global portfolio, we first develop a basic cross-sectional momentum example using the seven common asset classes that make up the Traditional Portfolio that we’ve outlined in the past, which includes: U.S. Stocks, Intl. Developed Stocks, Emerging Market Stocks, U.S. Real Estate, Long-Term Treasury Bonds, Gold, and Global Commodities. For the basic momentum strategy, each of these seven asset classes is ranked at the end of each month based on their individual return over the prior six months. The portfolio then rotates into the top four assets based on this return ranking, allocating an equal weighting of 25% to each – and this is then repeated each and every month going forward. This process will serve as our initial strategy, which will be referenced to as the Basic Momentum Model. As a reminder and baseline for comparison, we will compare this strategy to the historical performance profile of the equal-weight Traditional Portfolio. Applying this momentum methodology from 1995-2018 would have produced the following results.
Figure 1: Traditional Portfolio v. Basic Momentum Portfolio Equity Curves (1995-2018)

Figure 2: Traditional Portfolio v. Momentum Portfolio Performance (1995-2018)

We can note the Basic Momentum Portfolio exhibited higher compounded annual returns than the Traditional Portfolio between 1995 and 2018. We can also observe the improvements achieved in terms of portfolio risk, as maximum drawdown (i.e. maximum peak-to-valley decline) meaningfully improved, making this portfolio potentially an easier investment approach to adhere to during weaker economic times and market stress. Furthermore, as returns materially improved and portfolio volatility (i.e. risk) remained largely unchanged, the overall Return/Volatility Ratio increased from 0.60 to 0.83, marking a substantial improvement over the Traditional Portfolio. (It’s important to note that this historical analysis does not account for individual tax implications, which can, as with any active strategy, affect after-tax returns.)
In further exploring the Basic Momentum Portfolio, we take a look at its parameters (or rules), and ask questions as to why they were selected, and what would happen to the overall performance if we attempted to look for a more optimal set of parameters or strategy guidelines. Per the above example, how can we can we be confident a 6-month return is the proper momentum length, or if building the strategy with the top four positions is optimal versus the top five positions. Throughout the remainder of this insights piece, we will deploy what we have learned from the concept of the wisdom of crowds in an attempt to build a better momentum strategy compared to the basic approach outlined above.
Building a Momentum “Crowd” or Momentum Ensemble
In order to deploy the wisdom of crowds, multiple momentum strategies will need to be generated from the parameters that were used as inputs into the basic approach. The following table details each of the parameter inputs that were used in our previous example. To build multiple momentum strategies into what we call a Momentum Ensemble, each parameter will be varied one by one, and then analyzed historically to see how they stack up against the initial Basic Momentum Portfolio, the Traditional Portfolio, and to each other.
Figure 3: Momentum Parameter and Description
Momentum Measure
How the momentum factor is measured for a given time series. In our example, we explore the return over a set length of time for each of the assets within our asset class universe. Other indicators that are widely used to measure momentum include risk-adjusted returns, time above trend, moving average crossover signals, relative strength, and so-on. While there are many measures, they are all largely trying to capture any momentum return factors present in the global marketplace.
Momentum Length
Over what period of time are we calculating the momentum measure? In our example above, the length of time used to identify our momentum measure was 6-months, but shorter and longer periods can be used. In essence, the length of time used generally dictates how “fast” or “slow” a certain momentum system adapts as market trends and dynamics evolve.
Asset Class Selection
How should we rank and select the number of assets to make up the momentum portfolio? In the basic example above, we ranked and then selected the top four asset classes within a universe of seven; however, we can analyze systems that vary the number of asset classes selected for investment, as well.
Portfolio Rebalancing
How often will we assess the momentum measures and rebalance the portfolio? In our example, we are measuring momentum across each asset class, assessing a rank, and rebalancing the portfolio at the end of every month; however, this monthly rebalancing frequency can obviously be changed to shorter or longer windows - such as daily, weekly, quarterly or annually.
We start this analysis by differing the time periods over which momentum is measured (Momentum Length). As each new momentum strategy is derived, the performance can be compared against the others along with the Traditional Portfolio. Set forth below in Figure 4 are the results of momentum strategies using 4-month and 8-month lookbacks, as compared to the original 6-month lookback deployed in the Basic Momentum Model.
Figure 4: Momentum Portfolio Equity Curves by Momentum Length (1995-2018)
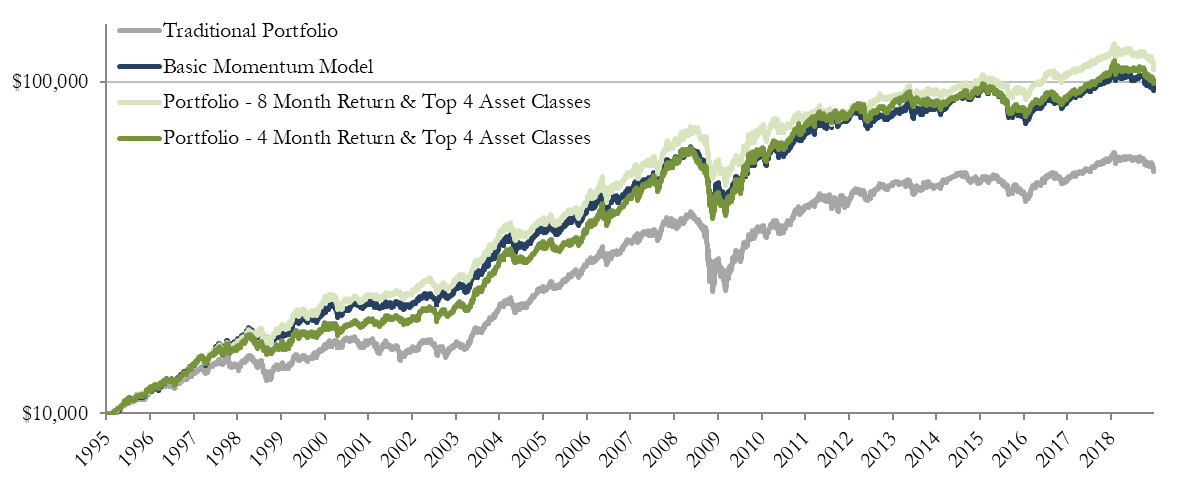
Taking an initial look at the ending analysis, each of the momentum strategies performed better than the Traditional Portfolio. We can also point out the 8-month momentum strategy tended to outperform the 4 and 6-month strategies from a total return perspective, albeit not by much. All in all, we can note the consistent outperformance of each of the momentum strategies over the buy & hold Traditional Portfolio, regardless of how we shift the Momentum Length parameter.
Next, we conduct the same analysis, this time shifting the number of asset classes taken within each strategy (Asset Class Selection). Specifically, we analyze the top 3 and top 5 assets and compare them against the Basic Momentum Model, which used the top 4 assets (note, once again, all other parameters will remain the same). Figure 5 details the outcome of each of the momentum strategies as we change the Asset Class Selection count.
Figure 5: Momentum Portfolio Equity Curves by Asset Class Selection (1995-2018)
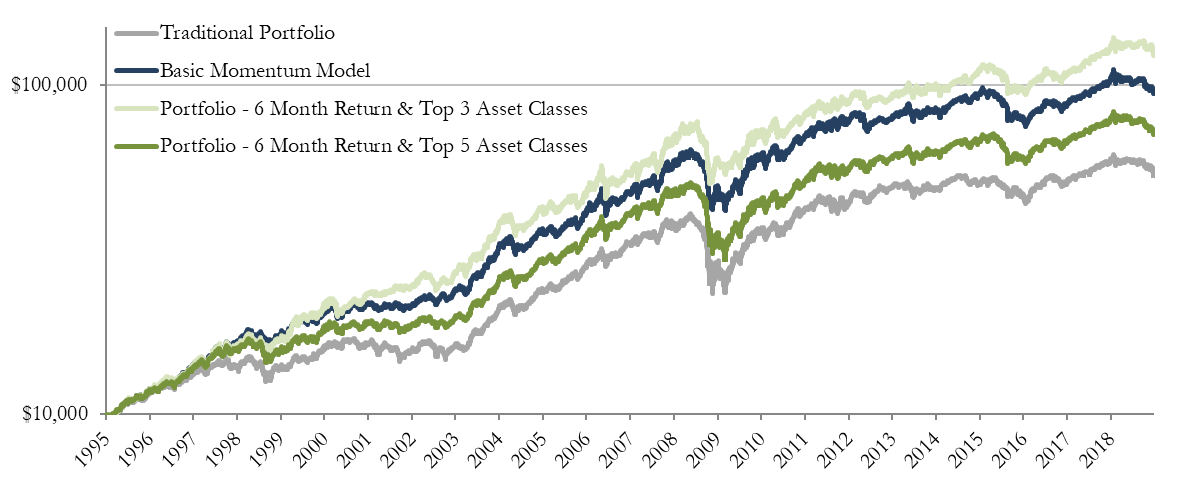
First, we can note in Figure 5 that each of the strategies once again outperformed the equal weight Traditional Portfolio, regardless of Asset Class Selection count or portfolio concentration. Further, it appears the portfolios holding fewer positions (3) outperformed those holding more (5). This makes intuitive sense, as when we lower the number of positions, the more concentrated the portfolio becomes on any one asset class and the momentum factor overall – but, it also tends increase overall portfolio risk as diversification is decreased.
As we continue to build out the various parameter combinations into the Momentum Ensemble, the number of momentum strategies available quickly increases exponentially. To better illustrate, Figure 6 details the possible parameter combinations using 2 Momentum Measures (total return, and risk-adjusted return), 11 Momentum Lengths (lookback periods of 2-10 months), 5 Asset Class Selection variations (top 2-6), and 1 Portfolio Rebalancing method (monthly).
Figure 6: Momentum Ensemble Parameter Combinations

Working through all of the possible combinations of parameters, we can note the expansion of total momentum strategies analyzed. Figure 7 demonstrates the buildup of each of the parameter variations to get to a total of 110 momentum strategies now included in the Momentum Ensemble.
Figure 7: Momentum Ensemble Strategy Count Buildup

From here, we can get a better idea of what this ensemble of strategies looks like by analyzing the array of their equity curves in Figure 8. Then, we can review their overall results and determine if there is an optimal parameter combination in capturing the underlying momentum factor that the original strategy set out to capture.
Figure 8: 110 Momentum Ensemble Equity Curves (1995-2018)

First and foremost, we can note that each of the 110 momentum strategies exhibited equity curves that moved up and to the right, which is certainly nice to see. The simple fact that none of the 110 strategies analyzed ended up moving down and to the right (i.e. produced negative returns) gives us further confidence in the reliability of using momentum as an investment style. In system strategy creation, this a very important feature and considered a sign of strategy robustness. In general, for a systematic strategy, while we don’t expect to see the exact same performance across the ensemble, it’s important to see consistency across strategies individually and consistent outperformance against a benchmark like the Traditional Portfolio. To restate, the graphic in Figure 8 shows a great deal of robustness and reliability within the effectiveness of the momentum factor.
Deploying the Power of Crowds and the Creation of an Ensemble Portfolio
Next, the question focuses on which of the 110 strategies will be the best performer going forward and should therefore receive an investment allocation. This is where things get rather interesting from an allocation standpoint and where we will deploy the wisdom of crowds concepts. Instead of going through the onslaught of issues in isolating a certain “best” parameter set (largely because each of the strategies presented within the ensemble are not statistically different), we can propose letting each of the ensemble strategies vote for the ending asset class allocations. To implement this wisdom of the crowds approach, we simply invest an equal amount in each of the 110 strategies. In a similar capacity to the way we allocated to our Blackjack Team, we will create an Ensemble Portfolio (in other words, a team of momentum strategies), which will consist of an equal amount of capital going into in each of our 110 strategies. Figure 9 analyzes the performance of the entirety of the 110-strategy ensemble by Return/Volatility quartile and compares them against the Ensemble Portfolio.
Figure 9: Momentum Ensemble Performance by Quartile (1995-2018)

As we compare the best and worst performing strategies along with each quartile to the performance of the Ensemble Portfolio, we can point out a few interesting items. First, overall returns are in line with the average strategy, which is to be expected when investing an equal portion of our portfolio in each of the momentum strategies. On the other hand, overall risk of the Ensemble Portfolio, measured by annual volatility, is the lowest out of any of the 110 strategies analyzed. Due to dramatic reduction in the annual volatility or risk of the Ensemble Portfolio, its Return / Volatility ratio of 0.86 lands in the 85th percentile when compared to the rest of the 110 strategies. To put it another way, by investing an equal amount in each of the 110 momentum strategies and not attempting to select the best strategy, we achieve the desired diversification effect brought on by the wisdom of crowds and obtain upper quartile performance anyway. More specifically, we have found that the Ensemble Portfolio consistently performs among the top 10%-15% of all strategies analyzed from a risk-adjusted return perspective over time – and we didn’t even have to try to choose which strategies might outperform.
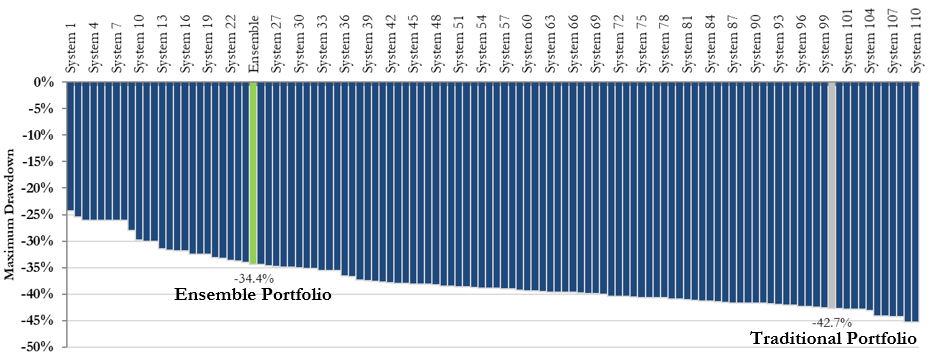
Upon further review of the Ensemble Portfolio results, it becomes very apparent that ignoring the concept of a “secret” or “best” parameter combination for a single momentum strategy and instead tapping into the wisdom of crowds (i.e. selecting them all), provides better performance from both a return and risk perspective. To further illustrate how the Ensemble Portfolio stacks up against the field, Figures 10a, 10b, and 10c illustrate the performance metrics of the Ensemble Portfolio versus the 110 individual systems with respect to their Return / Risk Ratio, 3-year worst return, and maximum drawdown. We can note, the Ensemble Portfolio ends up in the top 25% of all the strategies for each of the performance measures.
Figure 10a: Return/Risk Ratio: Ensemble Portfolio vs. All Strategies (1995-2018)
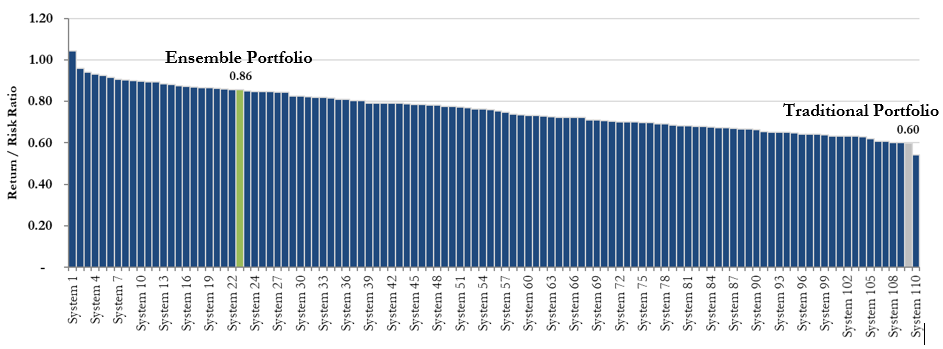
Figure 10b: Worst 3-Year Return: Ensemble Portfolio vs. All Strategies (1995-2018)

Figure 10c: Maximum Drawdown: Ensemble Portfolio vs. All Strategies (1995-2018)
What Global Portfolio did the Crowd Suggest?
To get a sense of the resulting global portfolio from the wisdom of the crowds momentum process, we can look at how the asset class positioning in the Ensemble Portfolio evolved from 1995-2018. More specifically, Figure 11 illustrates the allocations selected by our “crowd” or ensemble of momentum strategies within each year, and provides us with a better understanding of how these allocations shifted over time. First, we can note the lack of extremes in terms of overweighting or overly concentrating on any one asset class in any given year, which means the portfolio would have remained nicely diversified each year. We can also note the smoothness in the shifts in portfolio allocations as we move through time. (See: Why Being Dynamic Matters) This smoothing affect, caused largely by the ensemble voting mechanism, helps avoid knee-jerk reactions to market shocks – whereas individual momentum/trend systems will regularly make difficult all-in or all-out market timing decisions that lead to “zero or hero” moments that can take their toll on investor and advisor psychology, especially in more tumultuous environments. Moreover, this smoothing effect allows for reduced portfolio turnover, as well, making tax considerations much more amenable.
In summary, the lack of asset class concentration paired with more gradual portfolio adjustments over time is yet another feature of the Ensemble Portfolio, as diversification benefits are more continuously maintained and investors are not faced with stark rebalancing decisions on a regular basis.
Figure 11: Global Asset Class Allocations (1995-2018)

Ensemble Portfolio Results & Performance Comparison
In recapping the analysis behind creating the Ensemble Portfolio, we take a look at where we started and compare the performance metrics of each of the strategies discussed including the Traditional Portfolio, Simple Model (average), and the Ensemble Portfolio. The total return of the S&P 500 as a reference point for U.S. Stocks is also considered. Figure 12 displays the key performance metrics as it relates to each of the strategies.
Figure 12: Performance Comparison (1995-2018)

When comparing the performance metrics from 1995-2018, we can note that the Ensemble Portfolio outperforms across the board with respect to total returns, risk-adjusted returns (i.e. Return/Volatility), and less severe maximum drawdowns. Essentially, throughout the period analyzed, one would have achieved higher annual returns than U.S. Stocks (and substantially higher than the Traditional Portfolio) all with a less bumpy ride. Lastly, the Momentum Ensemble acts as a solid portfolio diversification tool, as its overall correlation to U.S. Stocks has been only 0.66. To conclude, from a risk and return perspective, not only is the Ensemble Portfolio extremely robust, it also outperforms the Traditional Portfolio and the commonly referenced S&P 500 over full market cycles. Once again, the win goes to the crowd.
Conclusion and the Impact of Letting the Wisdom of Crowds Choose
As we conclude, we can recap the benefit gained by deploying an ensemble approach to basic momentum strategies and why applying the wisdom of crowds in selecting multiple strategies is superior compared to picking and relying on a single strategy. By letting the crowd choose, we are able to access a portfolio that has better risk-adjusted returns and diversification benefits. We also eliminate the need of choosing the “best” momentum strategy that will outperform on a go forward basis. In a way, this eliminates the concept of luck (both good and bad) and bias from entering our strategy selection process, and therefore, we can avoid getting unlucky if what we thought was the “best” strategy historically ends up underperforming going forward. By investing in the Ensemble Portfolio, we are guaranteed the average result with respect to targeted momentum factor returns, but more importantly, we are expected to be in the top 10%-15% of all 110 momentum strategies with respect to risk-adjusted performance and other performance metrics. It’s an extraordinarily powerful concept that one can deploy the wisdom of crowds by investing in the average, yet consistently end up with upper-quartile results and outperform the majority.
We can also note, as it relates to quantitative investing, allocating capital into an ensemble versus a single strategy greatly reduces the risks of curve fitting and data mining – two common pitfalls in the field of quantitative investing. In other words, when practitioners attempt to construct attractive strategies based on historical data, it is a fairly common mistake for them to build in too many rules - tailoring (or fitting) the strategy to the historical market data to generate stunningly attractive historical results. The problem with this practice is that despite producing eye-popping backtests, it is highly unlikely that a strategy specifically tailored to the past will work in an uncertain future. And, as is often the case, when the rules of these highly-optimized (and highly fragile) strategies are changed ever so slightly, the historical results fall apart, showing a lack of true robustness. If, however, a strategy’s rules can be changed to large degrees, and therefore can be made into an effective ensemble, then better confidence in the strategy’s robustness and true edge can be obtained. Historically, we know which momentum parameter set was the best performer over varying time frames, but what we find more impactful and focus our attention on is the realized performance as we walk forward through time. At the end of the day, this is what we and the “crowds” will be investing in for the future - and for that portfolio, letting the wisdom of crowds cast their vote consistently beats the average, including the so-called “best” parameter set strategy.
To summarize, it is RQA’s view that when it comes to certain rules-based investment strategies, the proper approach lies within the crowd’s average. We will further suggest, regardless of your investment mandate (value, quality, dividend, growth, etc.), that building an ensemble where multiple basic strategies get a chance to cast their vote is a very robust way to capture the edge or phenomenon the strategy is targeting, while also minimizing strategy fragility. As it relates to the Momentum Ensemble, we should note that this is still a relatively constrained and simplified version, and the parameter sets analyzed can be expanded considerably. Further, we have found that meaningful additional improvements can be made through the use of more sophisticated asset allocation approaches within the ensemble, such as mean-variance and inverse-volatility weighting, instead of just simple equal-weight. Moreover, there is now a growing number of state-of-the-art machine learning methods that take these optimization techniques even further with surprising robustness, but that remains a separate discussion in itself and something worth exploring in future RQA Insights.
If you would like to learn more about the Ensemble Portfolio and the benefits of including a portion within your own portfolio or those of your clients, get in touch by visiting RichmondQuant.com.
To receive RQA Research and Updates, sign up with your email.
Disclaimer: These materials have been prepared solely for informational purposes and do not constitute a recommendation to make or dispose of any investment or engage in any particular investment strategy. These materials include general information and have not been tailored for any specific recipient or recipients. Information or data shown or used in these materials were obtained from sources believed to be reliable, but accuracy is not guaranteed. Furthermore, past results are not necessarily indicative of future results. The analyses presented are based on simulated or hypothetical performance that has certain inherent limitations. Simulated or hypothetical trading programs in general are also subject to the fact that they are designed with the benefit of hindsight.