

RQA Indicator Spotlight: PMI’s Mark an Inflection – Growth Accelerates on Two Fronts
The Dual Expansion
Manufacturing and services converge
For the first time since mid-2022, U.S. manufacturing and services are expanding in tandem. Manufacturing PMI reached its strongest reading since August 2022 at 52.7, while services extended its expansion to a twenty-first consecutive month at 54.0. Thirteen of eighteen manufacturing industries reported growth in March - the broadest participation since before the 2023 downturn.
The uneven, services-led cycle that defined the past two years is giving way to a more synchronized expansion. The “twin-engine” dynamic we have been watching develop now appears increasingly durable.
Infrastructure Demand
AI capex is feeding directly into industrial activity
The clearest structural driver remains AI and data center capital expenditure. Global data center capex rose sharply in 2025 and is projected to surpass $1 trillion in 2026, with hyperscalers continuing to scale infrastructure at an accelerated pace.
This is now showing up clearly in the composition of manufacturing growth. Demand is concentrated in categories tied to compute and power buildout - servers, storage, networking, and electrical infrastructure. The March ISM data reflects this linkage: the industries leading expansion are those most directly exposed to hyperscaler and utility investment cycles.
This is not a typical cyclical rebound in manufacturing. The breadth of expansion is being supported by a concentrated but durable source of demand. The durability of this trend, however, will depend in part on whether hyper-scaler spending remains economically justified as infrastructure scales.
Managing Through Volatility
Supply disruption is creating friction, not derailing growth
The expansion has remained resilient despite renewed geopolitical pressure. March PMI data captured supply chain stress tied to Middle East disruptions and energy price volatility, but underlying demand continues to hold.
Manufacturing new orders have now expanded for three consecutive months, while supplier delivery times continue to lengthen - a combination more consistent with demand strength than systemic breakdown. Energy markets have moderated from peak levels, though the conflict continues to introduce uncertainty around input costs and logistics.
Services activity reflects an economy adjusting rather than weakening. New orders reached their highest level since early 2023, while hiring remains measured - characterized by slower additions rather than outright cuts. The sectors driving growth - transportation, finance, and information services - continue to anchor the broader expansion.
Sustainable Momentum
Growth is broadening, but price pressure is the constraint
The primary tension remains the price environment. Both manufacturing and services reported meaningful increases in input costs in March, with pricing indices reaching multi-year highs. While some moderation in energy has occurred, costs remain elevated and sensitive to geopolitical developments.
Importantly, this rise in prices is occurring alongside expanding activity. That combination suggests demand resilience rather than deterioration, but it also introduces constraints. Stronger activity paired with rising costs limits the degree to which policy can ease and increases the likelihood of continued volatility.
Positioning Implications
Expansion is intact, but the path is less linear
The PMIs are sending a consistent signal: growth is broadening rather than peaking. Manufacturing is re-engaging, services remain stable, and underlying demand drivers - particularly AI-driven capital investment and core service activity - continue to support the cycle.
The risk is not a breakdown in demand, but variability introduced through supply-side pressures. Positioning should reflect participation in an ongoing expansion, with the expectation that the path forward will be uneven as markets adjust to periodic cost and supply shocks.
Economic Forecast Model
The RQA Economic Forecast Model climbed to 0.26 in March, continuing its steady three-month advance from January's 0.11 reading. This progression marks a clear shift from November's brief negative territory, with the model now comfortably above the zero-line expansion threshold. The current reading places the economy in constructive territory, signaling growth momentum has taken hold while remaining within normal expansion ranges.
TAKING A CLOSER LOOK AT THE ECONOMIC DRIVERS
The RQA heat map of economic drivers provides additional insight into the U.S. growth outlook. By examining trends across sectors—such as labor, industrial activity, and financial conditions—we gain a more detailed understanding of the economy's health and trajectory. This breakdown helps us anticipate potential shifts in growth expectations and inflation trends.
Standardized Economic Indicator Strength
Monthly heatmap — year-over-year standardized changes across major economic categories. Data reflects first releases through March 2026. Commentary may reference announcements within the month of publication.
March marked a clear inflection in the economic narrative. Manufacturing activity has now sustained expansion for three consecutive months, with the latest ISM reading representing the strongest performance in over a year. This isn't gradual improvement - it's a definitive break from the prolonged contraction cycle. Meanwhile, services remain firmly in expansion territory, cementing the twin-engine dynamic that has been developing.
The labor market delivered its own plot twist. After months of soft payroll prints, March posted a robust gain of 178,000 jobs - triple economist expectations and the strongest reading since late 2024. This wasn't broad-based strength; healthcare continued to do the heavy lifting, adding 76,000 positions. But the unemployment rate dropped to 4.3%, and crucially, initial unemployment claims have collapsed to multi-decade lows. The narrative of gradual weakening has been replaced by one of resilient, if concentrated, job creation.
Inflation, however, complicated the story. The Iran war sent energy costs soaring 10.9% in March alone, pushing headline CPI to 3.3% - the highest since April 2024. Yet beneath the surface, core inflation remained contained at 2.6%, suggesting the price surge reflects supply disruption rather than broad-based demand pressure. The Fed is now looking past the energy spike, with markets pricing essentially no chance of rate cuts through year-end.
Financial conditions remain supportive despite policy uncertainty. Corporate spreads continue to tighten, equity markets are posting solid gains, and consumer sentiment has improved meaningfully from winter lows - reaching its least pessimistic reading in months. The combination points to an economy absorbing supply shocks while maintaining underlying momentum.
The emerging picture is one of an economy broadening rather than peaking. Manufacturing has re-engaged, labor markets are tighter than the headlines suggest, and financial stress remains absent. The constraint is no longer demand weakness - it's supply-side volatility creating friction around what appears to be a fundamentally sound expansion.
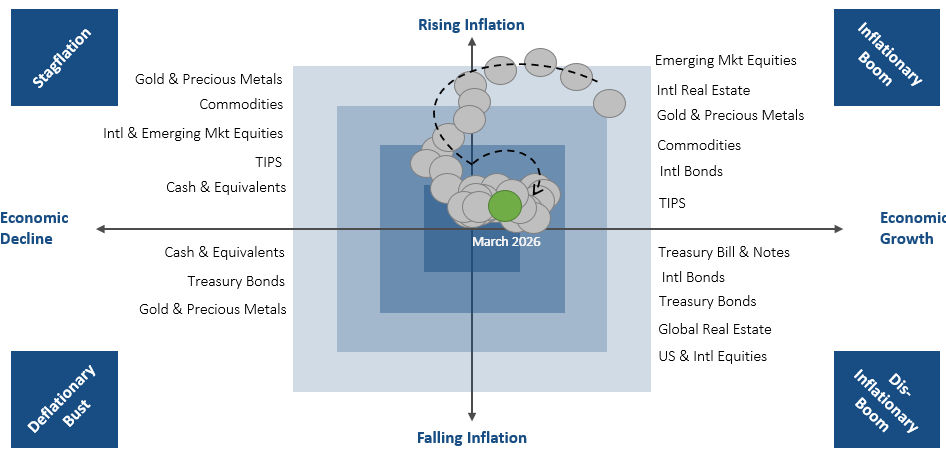
MARKET REGIME DISCUSSION
March delivered a textbook Quad 2 inflection - the RQA model's move to 0.26 coinciding with inflation's increase to 3.3% has pushed the economy decisively into reflation territory. This marks a sharp departure from the disinflationary backdrop that dominated much of 2025, when growth was rebuilding while price pressures remained contained.
The shift is evident in cross-asset performance patterns characteristic of reflationary periods. Energy and materials have outpaced defensives, while the dollar's recent softness against commodity currencies signals markets are pricing both stronger domestic activity and inflationary pressures that complicate Fed policy calculus.
What distinguishes this cycle is the speed of the regime transition - the move from November's stagflationary concerns to today's growth-inflation synchronization occurred faster than typical macro cycles. This velocity suggests markets are still calibrating to the new environment, creating both opportunity and volatility as positioning adjusts.
The key question becomes whether this Quad 2 dynamic proves durable or represents a temporary overshoot. Current readings favor continued pro-cyclical exposure, but the pace of change warrants close monitoring of both growth sustainability and Fed reaction functions.
Source: RQA.