

RQA Indicator Spotlight: Beneath the surface - a market of dispersion
In this month's update, we turn to a less commonly discussed but informative lens on equity markets: cross-sectional dispersion within the S&P 500. While index-level returns often dominate headlines, they can obscure the underlying distribution of outcomes across individual securities. Dispersion - the degree to which returns vary across constituents - offers a more complete view of how the market is behaving beneath the surface. A market that appears stable at the index level can still be experiencing significant internal movement, and dispersion helps quantify that difference.
What the Data Is Showing
Year-to-date, the S&P 500 has declined modestly, suggesting a relatively contained environment at first glance. However, the distribution of returns across the index tells a very different story. A substantial majority of constituents have moved meaningfully in either direction, with cross-sectional dispersion - measured as the standard deviation of individual constituent returns - running at approximately 21%, well above typical levels in the index's recent history.
What stands out in the data is not just the magnitude of moves, but how broadly they are distributed. Nearly three-quarters of the index has moved more than ±5%, split relatively evenly between gainers and losers, leaving only a small portion of stocks clustered near flat performance. In practical terms, the index return bears little resemblance to what the median constituent has experienced.
The dispersion is also highly asymmetric in magnitude. While the index itself is down only modestly, the tails of the distribution extend much further in both directions, with individual names up significantly on the year and others down sharply. This creates a situation where a relatively small number of large-cap constituents can anchor the index, even as a wide range of outcomes unfolds across the index.
Looking one layer deeper, the divergence between mean, median, and index-level returns reinforces this point. The cap-weighted index is being disproportionately shaped by a relatively small number of its largest constituents, while the median stock tells a different story, highlighting how aggregate performance can mask the breadth of what is happening underneath. This gap between index performance and the experience of the average stock has become a defining feature of the current environment.
A Market Moving in Different Directions
This dispersion is also evident across sectors and industries, where performance has become increasingly bifurcated. The spread between the strongest and weakest segments of the market is substantial, with certain areas posting strong positive returns while others have declined meaningfully year-to-date.
In fact, the difference between top- and bottom-performing sectors exceeds 40 percentage points, underscoring how uneven participation has become. Energy and commodity-linked exposures have led, while more cyclical and rate-sensitive areas have lagged, contributing to a market that is not moving uniformly higher or lower, but instead moving along multiple paths simultaneously.
Why It Matters
Dispersion plays a central role in shaping the opportunity set available to investors. In low-dispersion environments, returns tend to be driven primarily by market direction, with securities moving more uniformly and differentiation across positions limited. In contrast, high-dispersion environments create a wider range of outcomes, where the spread between winners and losers increases and returns become more sensitive to positioning and selection.
Dispersion alone does not tell you whether the market is healthy or fragile — but the composition of that dispersion does. When elevated dispersion is driven by capital rotating into new areas of leadership — previously lagging sectors beginning to attract flows and contribute to returns — it can be a constructive signal, suggesting the market is building a broader foundation. When it is driven by aggressive divestment from the largest and most heavily weighted names, particularly in technology, that concentration unwind can drag index-level performance lower even as opportunities emerge elsewhere. Monitoring not just how dispersed returns are, but what is driving the divergence, offers a more actionable read on whether the current environment is one of healthy broadening or early-stage stress.
What to Watch
The persistence of elevated dispersion will be an important factor to monitor in the months ahead. If dispersion remains elevated, it would suggest a continued environment of differentiated outcomes where flexibility and dynamic positioning remain valuable. If dispersion begins to compress, the framework above applies — the question is not simply whether dispersion is rising or falling, but what is driving the shift and whether it reflects genuine broadening or concentrated retreat.
While the S&P 500 provides a useful summary of market performance, it does not fully capture the complexity of the current environment. Beneath a relatively modest index move lies a market defined by wide dispersion, uneven participation, and concentrated leadership. Understanding that distinction — between the index and the underlying distribution — offers a clearer view of where we are today and how the opportunity set is evolving.
Economic Forecast Model
The RQA Economic Forecast Model continued its gradual climb in February, registering its highest reading since mid-2025. The model has now posted three consecutive monthly increases after bottoming near zero in October, confirming a shift from the sideways-to-negative drift that characterized much of the second half of last year. That said, the level remains modest - well below the readings typically associated with strong expansion phases, which historically range from 0.30 to 1.00.
This positioning reflects an economy that is growing but without meaningful momentum behind it. Manufacturing activity has sharply improved and sentiment has begun to recover, but labor market softening and re-firming inflation are pulling in the opposite direction. The model's trajectory is constructive, but the signal remains one of early stabilization rather than confirmed acceleration.
TAKING A CLOSER LOOK AT THE ECONOMIC DRIVERS
The RQA heat map of economic drivers provides additional insight into the U.S. growth outlook. By examining trends across sectors—such as labor, industrial activity, and financial conditions—we gain a more detailed understanding of the economy's health and trajectory. This breakdown helps us anticipate potential shifts in growth expectations and inflation trends.
Standardized Economic Indicator Strength
Monthly heatmap — year-over-year standardized changes across major economic categories.
The most significant development in February's data is the sharp reversal in manufacturing. After more than a year of contraction, the ISM Manufacturing PMI surged into expansion territory - its strongest reading in the trailing period - with residential building permits also turning positive. This is consistent with the AI and infrastructure-related capex thesis we have been tracking, and suggests the manufacturing-services divergence that defined much of 2025 may be closing. Services activity remains firmly in expansion, making this the first month in the window where both sectors are contributing.
The labor picture, by contrast, has softened. Non-farm payrolls posted their first negative year-over-year reading, initial claims reversed from recent improvement, and our labor composite slipped back into negative territory. Employment-to-population ratios remain soft. The data are not signaling acute deterioration - hours worked ticked up - but the trajectory has clearly shifted from stabilization to mild weakening, a development worth watching closely.
On inflation, progress has stalled. Core PCE moved higher to 3.4%, its highest reading in the trailing window, while headline CPI edged up modestly. The disinflation narrative that supported rate cuts last year has lost further momentum. The Fed remains on hold at 3.5%–3.75%, and recent FOMC minutes showed members increasingly divided, with several flagging the possibility that hikes could become necessary if inflation persists.
Consumer sentiment, while still deeply negative on a year-over-year basis, has improved meaningfully from its recent trough - a notable shift from the readings that dominated much of 2025. As we have discussed in prior research, the gap between financial conditions and household perceptions remains wide, but the direction of travel is constructive for the first time in several months.
Overall, this month's data present an unusually mixed picture. Manufacturing strength and improving sentiment are genuine positives, but a softening labor market and re-firming inflation pull in the opposite direction. The economy continues to grow, but the composition of that growth is shifting in ways that bear monitoring.
MARKET REGIME DISCUSSION
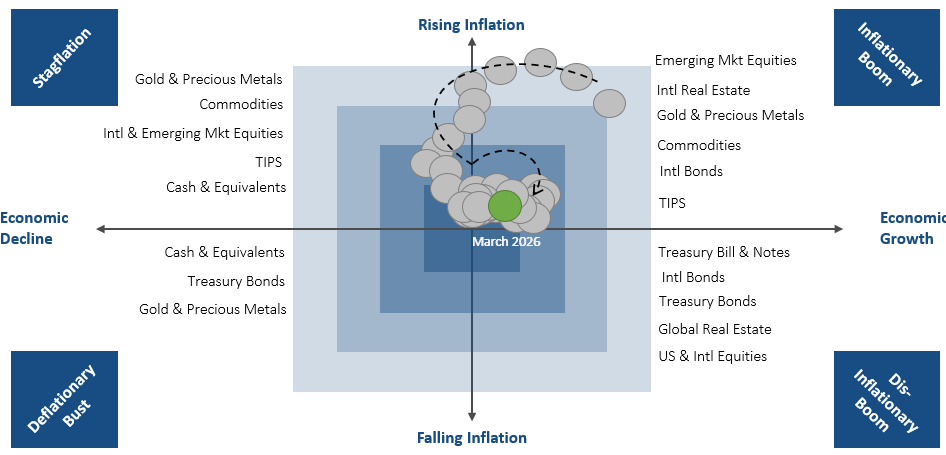
The regime framework continues to reflect an economy with both positive growth and elevated inflation, placing the current reading in the Inflationary Boom quadrant. The growth signal has strengthened over the past three months, moving from zero-bound territory in late 2025 to its most positive reading in several months. Inflation remains elevated and above target - keeping the regime firmly in the upper-right quadrant.
This positioning is visible in the trail of prior readings, which shows a clear rightward shift from the center of the map as growth has firmed. The combination favors real assets, commodities, and inflation-sensitive equities - precisely the areas that have led year-to-date, as reflected in our sector heat strip where energy and materials sit at the top of the return distribution.
Dispersion remains the dominant market theme. International equities and commodity-linked names continue to outperform domestic large-cap, while technology and consumer discretionary lag. Equal-weight indices outperforming cap-weighted reinforces that the current environment rewards breadth and active positioning over concentrated beta.
Looking ahead, the durability of the current regime depends on whether the manufacturing recovery broadens and whether the labor market stabilizes before inflation forces the Fed's hand. For now, the regime favors real assets and selective equity exposure tilted toward sectors and geographies aligned with the inflationary-growth backdrop.
Source: RQA.