

RQA Indicator Spotlight: Sentiment Update – The Pessimism Premium
In this month's update, we return once again to the University of Michigan Consumer Sentiment Index — a data set we have now tracked through three distinct chapters. What began as a discussion of extreme pessimism in November 2022 was revisited in January 2024 as a retrospective validation of the contrarian signal, and now warrants a third look given where the index sits today.
To briefly recap the framework: the Michigan Consumer Sentiment Index surveys consumers across three core dimensions — their view of personal financial conditions, near-term economic prospects, and long-term economic expectations. The index oscillates around its long-term average of approximately 84, with readings above that level reflecting consumer optimism and readings below it reflecting growing pessimism with respect to both personal financial well-being and the broader economic outlook.
When we first highlighted this data set in November 2022, the index had plunged to approximately 50 — a multi-decade low driven by rampant inflation and an aggressively tightening Federal Reserve. We noted that extreme pessimism of this variety can act as a contrarian signal, while cautioning that these readings can fluctuate before a trend reversal is confirmed.
When we revisited the data in January 2024, we were able to confirm that the 2022 trough had marked a significant sentiment low and a compelling contrarian entry point for risk assets. The S&P 500 climbed more than 20% in the twelve months following that pessimism extreme — a pattern entirely consistent with what the historical data had suggested was likely.
At the time of our January 2024 update, sentiment had recovered to approximately 80 and we flagged that the index approaching or exceeding 100 would warrant attention as a potential contrarian signal from the other direction.
Where the Index Stands Today
The current picture is striking. After recovering toward the 70–80 range through 2024, sentiment reversed sharply throughout 2025. The January 2026 final reading came in at 56.4 — roughly 33% below the long-term historical average of 84 and approximately 21% below where it stood just one year prior. To put that level in broader context, the current reading sits below the index's starting point at the onset of every U.S. recession going back to the index's inception.
As shown in the chart above, the recent decline has produced one of only a handful of sustained troughs in the index's 48-year history. Today's pessimism is rooted in a more diffuse set of concerns than the inflation-driven 2022 episode: residual pressure from elevated prices, uncertainty around trade and tariff policy, and growing anxiety about labor market conditions. Year-ahead inflation expectations, while recently improving to 4.0% in January, remain well above the 2.3%–3.0% range that prevailed in the two years prior to the pandemic.
The Contrarian Signal, Revisited
Our prior analysis has documented that extreme pessimism in the sentiment index has historically been associated with above-average forward returns in risk assets. The updated graphic below extends this analysis through the current period, annotating key sentiment turning points with the corresponding forward 12-month return in the S&P 500.
The pattern is consistent across the prior troughs we have identified: the May 1980 low was followed by a 22% return, the October 1990 low by 26%, the November 2008 low by 25%, the August 2011 low by 18%, and the September 2022 low by 22%. Conversely, sentiment peaks — such as January 2000 and January 2007 — have historically been followed by weak or negative equity returns.
With current sentiment readings near November 2025 lows that rival the most extreme pessimism in the index's history, the historical pattern would suggest an above-average probability of strong forward returns in risk assets from these levels. That said, an important nuance distinguishes the current setup from prior troughs: the 2022 low was driven largely by a single, identifiable catalyst — the post-pandemic inflation surge and the Fed's response to it — which created a relatively clear resolution path once the tightening cycle plateaued. Today's pessimism is more structural in origin, with policy uncertainty and residual price pressures presenting a murkier backdrop. The signal remains relevant; it simply calls for patience.
A Note on the Composition of Sentiment
One development within the recent data worth brief mention: aggregate sentiment figures have begun to mask a divergence across the wealth spectrum. Over the past several months, consumers with meaningful equity portfolio exposure have shown some recovery in sentiment, while those without stock holdings have remained at historically depressed levels. This bifurcation — which has been explicitly noted in recent Michigan survey commentary — is consistent with the broader "K-shaped economy" narrative that has gained traction in current economic discourse.
The practical implication is that the headline index may modestly overstate the health of the typical consumer when equity markets are performing well, as asset appreciation disproportionately benefits higher-wealth households. As with all aggregate economic indicators, the underlying composition can be as informative as the headline number itself.
We will continue to monitor both the trend and the composition of this data set. As we have noted across three editions of this discussion, sentiment extremes — in either direction — have proven to be among the more reliable inputs in identifying meaningful turning points in the market cycle.
The Michigan Consumer Sentiment Index is produced by the University of Michigan Surveys of Consumers program and is conducted monthly based on a nationally representative sample. Data referenced above reflects the January 2026 final revised release.
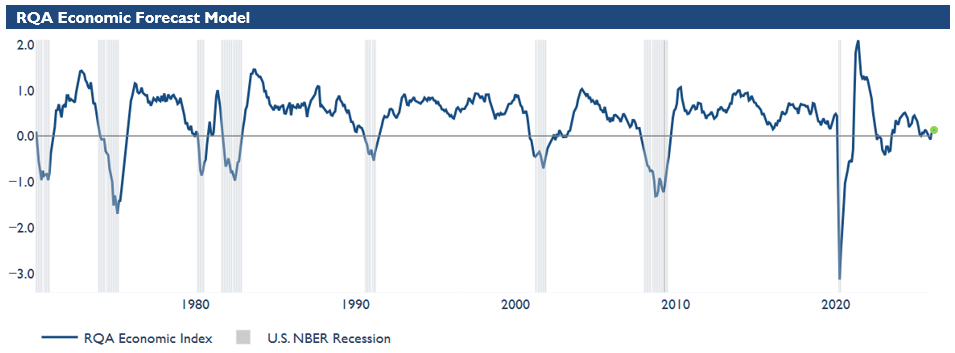
Economic Forecast Model
The RQA Economic Forecast Model has moved back into positive territory, registering its highest reading in five months. While the improvement is a constructive shift from the sideways-to-negative drift that characterized much of the second half of 2025, the level remains modest — well below the readings typically associated with strong expansion phases, which historically range from 30 to 100.
This positioning reflects an economy that is growing and no longer deteriorating, but without meaningful momentum behind it. Inflation has moderated, growth expectations have stabilized, and the model's trajectory has turned higher — all positive developments. But the signal is one of early improvement rather than confirmed acceleration.
Source: Analysis by RQA. Data from U.S. Federal Reserve; Bureau of Labor Statistics; Norgate Premium Data; Institute for Supply Management.
The RQA Economic Forecast Model represents a consolidated composite of key economic leading indicators and market-based explanatory variables. The goal of this composite model is to present a holistic measure of primary U.S. economic growth drivers and their trends over time. (Additional detail on the model’s construction is provided here.)
Values above the zero-line are indicative of positive U.S. economic growth expectations in the near-term, and therefore, indicate economic strength and lower probability chance of recessionary pressure. On the other hand, values below the zero-line represent the opposite - a more negative outlook and more elevated probabilities of the U.S. experiencing an economic contraction.
TAKING A CLOSER LOOK AT THE ECONOMIC DRIVERS
The RQA heat map of economic drivers provides additional insight into the U.S. growth outlook. By examining trends across sectors—such as labor, industrial activity, and financial conditions—we gain a more detailed understanding of the economy's health and trajectory. This breakdown helps us anticipate potential shifts in growth expectations and inflation trends.
Standardized Economic Indicator Strength
Monthly heatmap — year-over-year standardized changes across major economic categories.
Recent data continue to reflect steady but uneven economic conditions, with persistent divergence between manufacturing and services. Through January's data, manufacturing remains in contraction while services posted their strongest reading in the trailing period. That said, the gap may be poised to narrow — early February releases suggest the AI and data center capex cycle we flagged last month is beginning to reach goods-producing activity, something to watch in coming months.
Labor market stability remains the key story. Our composite measure has recovered from the deeply negative readings that persisted through mid-2025, supported by improving initial unemployment claims. Payroll growth continues to decelerate and employment-to-population ratios remain soft, but claims data suggest employers are holding onto workers rather than cutting — a distinction the Fed echoed at its January meeting and one that supports the durability of the current expansion.
On inflation, the picture has improved modestly. CPI has moderated back toward the mid-2s after a stretch of stickier readings, representing incremental but meaningful progress. This gives the Fed somewhat more room to maneuver, though the path to target remains gradual. Markets continue to price the next cut for June at the earliest.
Consumer sentiment remains the area of greatest concern, and one we have explored in our prior research on the divergence between financial conditions and household perceptions. The Michigan index sits roughly 20% below year-ago levels, with gains concentrated among wealthier households with equity exposure while sentiment for non-stockholders remains depressed. This bifurcation continues to represent a vulnerability for consumption if labor conditions soften further.
Overall, the data point to a moderate-growth regime that is firming rather than merely holding together. Labor stability provides a foundation, and moderating inflation has eased one of the key constraints on the outlook. That said, deeply negative sentiment and uneven income dynamics suggest the margin of safety remains thinner than headline financial conditions imply.
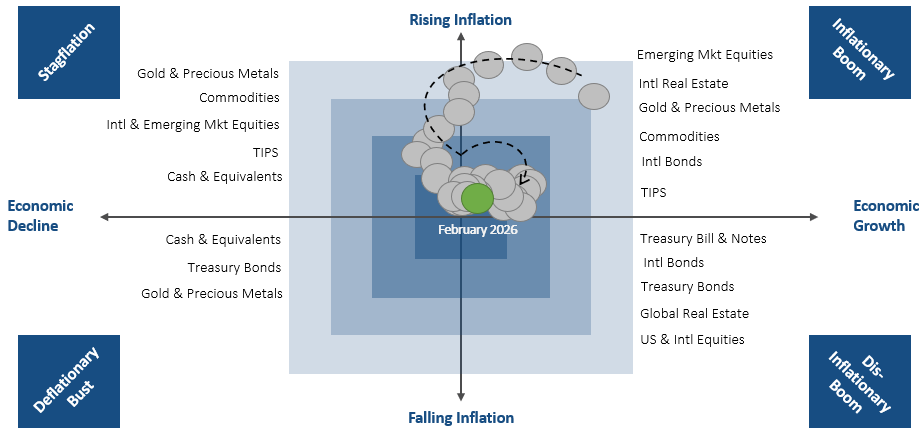
MARKET REGIME DISCUSSION
The regime framework has shifted modestly but meaningfully since last month, with the growth signal moving back into positive territory alongside continued moderation in inflation. This combination — improving growth momentum with contained price pressures — represents a constructive shift from the sideways drift that characterized recent months.
Dispersion remains the dominant theme, both across and within asset classes. In equities, AI-related names — particularly in the software space — continue to face pressure, while international equity markets and select areas of the commodity spectrum have emerged as sources of opportunity. This pattern reinforces a market environment where broad beta is less rewarding than active positioning across geographies and sectors.
Looking ahead, the key question is whether the nascent improvement in growth momentum broadens further or stalls amid lingering policy uncertainty and sticky wage dynamics. For now, the regime signal favors modest expansion with enough cross-asset dispersion to reward selective allocation.
Source: RQA.