

RQA Indicator Spotlight: repricing the path -fed Easing Shifts to tightening
In barely five months, the market has gone from pricing Federal Reserve rate cuts to pricing a hike, a swing of nearly ninety basis points in the year-end expectation. That expectation lives in the forward curve: the path of future short-term rates that investors are collectively betting on, read from interest-rate futures. At the start of the year the curve sloped gently downward, pricing one to two cuts and a slow drift toward a neutral rate near 3.0%. By late June it had reversed, pricing a hike by September and a higher-for-longer plateau into 2027. The question that matters most for positioning is whether that reversal was a necessary correction or a market getting ahead of itself.
A Rapid Repricing
What makes the move notable is its speed. A forward curve usually drifts; this one flipped. The same instrument that pointed toward easing in January was, by June, pricing a fundamentally different policy path, and the market now puts roughly two-in-three odds on at least one hike by September, with essentially no chance of a cut. Three forces drove the turn, and the rest of this note takes them in order: an inflation backdrop that was firmer than it looked, an energy shock that lit the fire, and a new Fed chair whose first meeting gave the market license to reprice.
A Shock on an Already-Firming Base
It would be convenient to pin the move on one event, but the truth is more textured. Inflation was firming well before the conflict began. Core prices had been grinding higher for months on tariff-related costs and the familiar stickiness of shelter, climbing from 2.5% at the start of the year to 2.8% by April, that month's increase the largest in over a year. The economy was not at target and drifting lower. It was above target and creeping up.
The energy shock amplified those pressures. The closure of the Strait of Hormuz, which carries about a fifth of the world's oil, choked global supply, and the effect ran straight through the headline: consumer prices reached 4.2% in May, with energy alone accounting for over sixty percent of the monthly increase. What it has not done, at least not yet, is spread. Core inflation came in as expected, its monthly pace actually cooling, and core goods prices fell for the first time in over a year. That leaves the read genuinely two-sided. The hawkish worry is that core already sits near 3.0% with shelter sticky, leaving no cushion for an energy shock on top. The dovish rejoinder is that the shock never reached core at all, and energy is already reversing.
Now the Shock Is Reversing
The shock has begun to unwind nearly as fast as it arrived. As a US-Iran framework took hold and tankers began moving through the Strait again, with Persian Gulf exports restarting for the first time since March, crude retraced its entire wartime spike and fell back toward pre-conflict levels, dragging gasoline lower. On that path, May looks increasingly like the inflation peak, leaving the late-June rate curve pricing persistence into a pressure that may already be fading.
The relief deserves the same skepticism as the scare. The reopening rests on an interim arrangement, not a settled peace, and the flow of oil has only begun to normalize. Transit is resuming, but insurance premiums remain elevated and full pre-conflict volumes are still months away. Prices have raced ahead of that physical reality, pricing a clean resolution that has only partly arrived. Both ends of the curve are now leaning on expectation rather than fact.
A New Chair, saying less
The curve's steepest move came around the June meeting, the first under the Fed's new leadership. The decision was a hold, but almost everything around it leaned hawkish. The committee issued a strikingly abbreviated statement that named energy supply shocks directly, dropped the forward guidance markets had grown used to parsing, and published rate projections split evenly between those expecting steady rates or a cut and those expecting a hike, with the median tipping toward tightening. The new chair declined to submit a projection at all.
The market read it loudly. The two-year yield jumped to a one-year high, the dollar posted its strongest day in nearly a year, and rate-sensitive assets sold off. The late-June curve in the exhibit is, in effect, a snapshot of that reaction. The most candid note came from the chair himself, who acknowledged the committee remains divided on whether this is a first-round energy event or the start of something more persistent. "No resolution or conviction," in his words, with another meeting six weeks out before the picture clarifies.
Which leaves the central question open, as it probably should be. The curve has moved from cuts to hikes with force, atop an energy shock that may be reversing, against a structural backdrop no one fully agrees on, prompted by a Fed that has told us plainly it is not yet sure. Whether June marked a durable regime shift or an overcorrection is too early to call. That is exactly what the regime framework has to navigate next.
Economic Forecast Model
The RQA Economic Forecast Model eased modestly in May, registering 0.27 after April's 0.33. The reading holds comfortably in positive territory, continuing to point to near-term growth and low recession risk - the slight pullback reflects a model leveling off after a steady winter-to-spring climb, not a turn lower. The signal remains one of an economy still expanding, even as an energy-driven price shock complicates the backdrop. Momentum has cooled a touch from its early-spring pace, but the model's message is continuity: growth, intact.
TAKING A CLOSER LOOK AT THE ECONOMIC DRIVERS
The RQA heat map of economic drivers provides additional insight into the U.S. growth outlook. By examining trends across sectors - such as labor, industrial activity, and financial conditions - we gain a more detailed understanding of the economy's health and trajectory. This breakdown helps us anticipate potential shifts in growth expectations and inflation trends.
Standardized Economic Indicator Strength
Monthly heatmap — year-over-year standardized changes across major economic categories. Data reflects first releases through May 2026. Commentary may reference announcements within the month of publication.
May's heatmap captures an economy still growing, but with a clear shift in where the pressure sits. The inflation block has turned: CPI, Core PCE, and M2 now register in cautionary territory, with headline prices running well above target on the back of the energy spike detailed in this month's spotlight. After two years of grinding disinflation, the direction has reversed - and the heatmap's banded coloring flags these readings as running hot rather than healthy.
The real economy beneath the prices is mixed but holding. Commercial output remains a source of strength: the ISM services and manufacturing readings are firmly positive, a continuation of the broadening we flagged earlier this year, though the rate-sensitive corners - industrial production and residential permits - have softened under higher-for-longer policy. Consumption is steady, with real spending positive and the RQA Consumer Spending Composite intact, even as real incomes decelerate and sentiment stays depressed. Labor has cooled from its early-spring strength without breaking, payroll momentum easing while the composite fades toward neutral.
Financial conditions are the clean bright spot - equity returns are strong, credit spreads remain well-behaved, and the yield curve has held its modest positive slope. The emerging picture is of an economy whose growth engine is still running, but whose dominant story has rotated from broadening output to firming prices. The constraint is no longer demand - it's inflation, re-emerging as the variable that matters most.
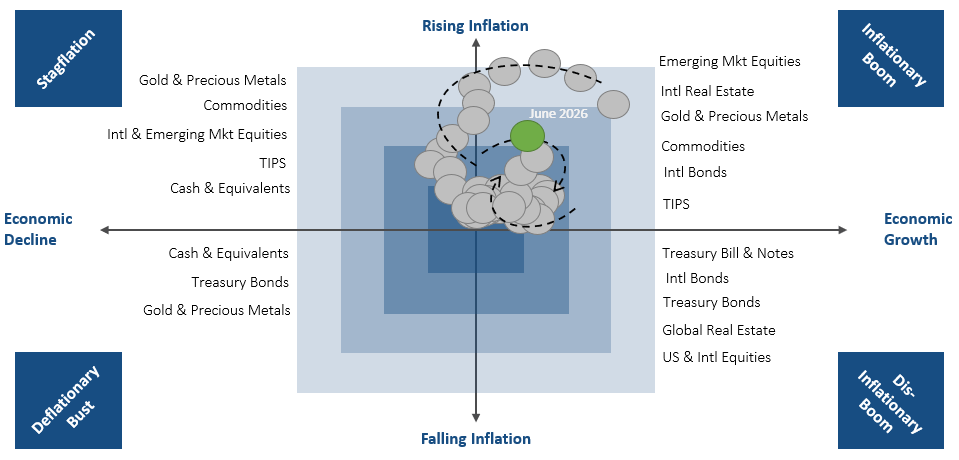
MARKET REGIME DISCUSSION
The regime framework remains where it has sat for several months, in the Inflationary Boom quadrant, with growth positive and inflation rising. But the balance within it has shifted. Inflation has climbed decisively, CPI moving from the mid-2% range at the start of the year to 4.2%, while the growth signal, still firmly expansionary, eased at the margin. The dot stays in the upper-right, but the trajectory now leans toward the stagflation corner: prices pressing higher as growth holds rather than accelerates. It is a drift, not a regime change, but it is the drift we have been watching for since the spring.
The market backdrop tracks the spotlight's story closely. Rates picked up alongside oil as the energy shock pushed inflation expectations higher, repricing the forward curve from cuts to hikes, though that move has eased as crude has retreated. The reversal is visible across real assets. Gold and commodities, which led for much of the year, have corrected sharply, and the dollar is rebounding as higher-for-longer expectations take hold. That rotation is consistent with a regime shifting from reflation toward stagflation, where dollar strength and short-duration exposure tend to outperform the commodity and real-asset trades that worked on the way up.
For now, the framework still favors real assets and international exposure over duration-sensitive domestic assets, but the recent correction in commodities and the dollar's recovery are worth respecting as early signals of the rotation underway. The durability of the move hinges on the same unresolved question the Fed has flagged: whether the inflation is a first-round energy event that fades, or the start of something stickier. If oil's retreat holds and growth steadies, the economy settles back into a benign inflationary expansion. If prices stay sticky while growth softens further, the stagflation corner becomes the destination. The regime favors patience, and a close eye on whether the recent commodity correction marks a pause or a turn.
Source: RQA.