

RQA Indicator Spotlight: Real Personal Income — Tracking the Foundation
Understanding the recent deceleration in income growth
Real Personal Income excluding Transfer Receipts measures inflation-adjusted income from all sources - wages, salaries, proprietors' income, rents, dividends, and interest - while excluding government transfer payments such as Social Security and unemployment benefits. Because wages and salaries make up the largest share of the total, the series serves as a strong proxy for the economy's organic income-generating capacity, providing insight into whether economic expansion is income-supported or increasingly dependent on other funding sources like credit expansion or asset appreciation.
The measure serves as a useful gauge for distinguishing between income-led and consumption-led growth phases. Income-led periods, where rising real incomes drive spending increases, tend to be more sustainable and self-reinforcing. Consumption-led periods, where spending outpaces income gains, can support growth in the near term but typically require alternative funding sources to maintain momentum.
Real Personal Income — Tracking the Foundation
Recent Performance and Context
Real personal income excluding transfers reached 4.5% year-over-year growth in May 2025 before moderating to 1.1% by April 2026. This deceleration reflects several factors: labor market tightness has eased from extreme levels, and inflation persistence has pressured real purchasing power despite continued nominal wage gains. Notably, this softening has occurred even as productivity growth has shown signs of rebounding — a dynamic that would ordinarily support real incomes, underscoring that the drag is coming from the labor-market and price channels rather than from deteriorating output per worker.
The six-month rate of change has continued to compress toward the zero bound, indicating the slowdown is still underway rather than stabilizing. While growth remains positive, the momentum shift suggests the economy's income-generating capacity has softened meaningfully from its recent peak.
Importantly, a decelerating rate of change in real income does not by itself signal contraction. Spending can continue to expand even as income momentum fades, provided households draw on accumulated savings, extend credit, or spend against asset-driven wealth gains. The falling personal saving rate alongside continued real consumption growth is consistent with exactly this pattern. That distinction is what this series is built to surface: not whether the economy is growing, but what is funding the growth — and a sustained drift from income-led toward consumption-led support is the signal worth watching here.
Implications and Monitoring Framework
This pattern raises questions about the durability of current consumption levels relative to underlying income support. Several indicators will help determine whether this represents temporary cyclical cooling or a more sustained shift toward non-income funding sources.
Recovery signals would include employment growth acceleration, particularly in higher-paying sectors, and inflation moderation that restores real purchasing power — with the recent firming in productivity a supportive backdrop already in place. Conversely, further deceleration in income growth, widening gaps between consumption and income trends, or increased reliance on credit expansion would suggest a transition toward consumption-led growth patterns.
From a positioning perspective, income deceleration typically favors shorter duration exposure, emphasis on credit quality, and sectors less dependent on discretionary spending growth. The current trajectory suggests monitoring these transition indicators rather than assuming automatic mean reversion in income trends.
Economic Forecast Model
The RQA Economic Forecast Model increased to 0.33 in April, marking its strongest reading in eight months and extending a four-month climb from December's brief negative territory. The model has now posted consecutive monthly gains since January, with April's continued acceleration (from 0.26 in March) signaling broadening economic momentum despite persistent sectoral headwinds. This level sits well above the zero-line expansion threshold, approaching the 0.4-0.5 range that typically accompanies sustained growth phases. The trajectory reflects an economy gaining genuine traction after months of tentative recovery, with improving forward-looking indicators offsetting energy shocks.
TAKING A CLOSER LOOK AT THE ECONOMIC DRIVERS
The RQA heat map of economic drivers provides additional insight into the U.S. growth outlook. By examining trends across sectors—such as labor, industrial activity, and financial conditions—we gain a more detailed understanding of the economy's health and trajectory. This breakdown helps us anticipate potential shifts in growth expectations and inflation trends.
Standardized Economic Indicator Strength
Monthly heatmap — year-over-year standardized changes across major economic categories. Data reflects first releases through April 2026. Commentary may reference announcements within the month of publication.
April's data pointed to a broadening but moderate expansion. The ISM Manufacturing PMI held in expansion territory, running roughly 5% above its baseline — a steady reading that confirms the sector is no longer contracting, though the pace is modest rather than a sharp breakout. Services remained the firmer of the two, holding around 8% above baseline and continuing to anchor overall activity. Together the two surveys describe an economy in steady, broad-based expansion, with manufacturing stabilizing while services carries the bulk of the momentum.
Labor markets demonstrated pockets of resilience, with the RQA Labor Composite rising to 3.7% year-over-year on a marked improvement in jobless claims, though softening payrolls point to a more uneven labor backdrop beneath the composite. Consumer spending patterns reflect this improved labor backdrop, with real personal consumption expenditures advancing 2.0% annually despite elevated price pressures. Financial markets responded decisively, with equity returns increasing to more than 25% year-over-year as investors priced in sustained economic acceleration.
The inflation picture remained complex, with headline CPI at 3.3% even as core PCE — the Fed's preferred gauge — held elevated at 4.0%, well above target. The divergence reflects persistent services and housing pressures in the core measure despite softer headline readings. Corporate bond spreads widened as markets balanced growth optimism against inflation persistence, with the 10-year yield curve maintaining a modest positive slope as term structure normalization continues.
The Federal Reserve faces an increasingly nuanced backdrop as Chair Warsh takes the helm, with broad-based activity complicating the inflation-fighting mandate from the outset of his term. Financial conditions have tightened modestly despite growth momentum, reflecting market anticipation of extended monetary restrictiveness.
The emerging picture is one of an economy on a firmer, if uneven, footing after its recent malaise. Manufacturing has stabilized in expansion, labor markets show selective resilience, and consumption has remained firm even as consumer sentiment stays notably weak. The constraint is shifting from demand adequacy toward whether supply-side capacity can keep pace with steady activity without reigniting the inflation pressures that would force more aggressive policy intervention.
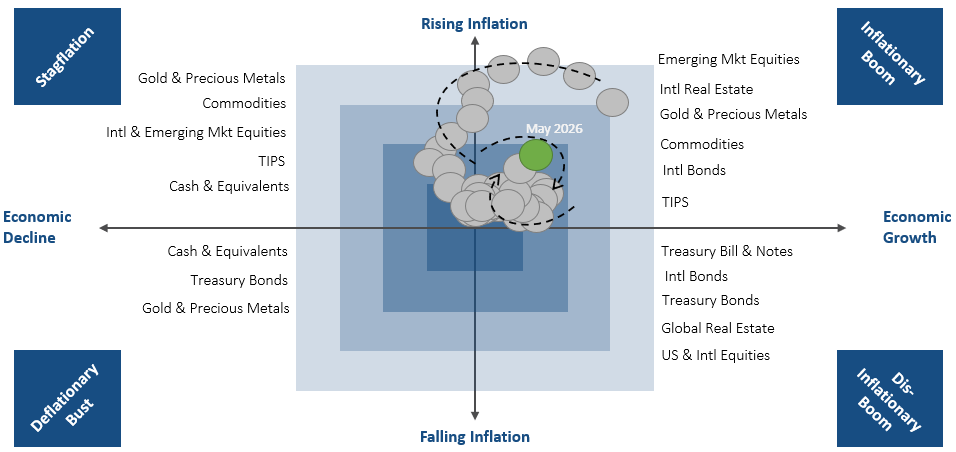
MARKET REGIME DISCUSSION
The regime framework reflects a decisive shift toward a reflationary quadrant, characterized by accelerating growth momentum and persistent inflation pressures. April's data showed the RQA Economic Model increasing to 0.33 while core inflation measures remained elevated, positioning the economy in a challenging but opportunity-rich environment. This combination creates both policy complexity and asset allocation clarity as growth acceleration validates risk-taking while inflation persistence supports real asset positioning.
Market behavior reflects this regime evolution, with broad-based equity strength accompanied by continued pressure on duration assets as markets price sustained economic vigor. The manufacturing sector's return to steady expansion has supported industrial and cyclical participation, while continued services strength underpins broad-based activity. Credit markets show mixed signals - corporate fundamentals improve with growth acceleration, but inflation persistence and Fed hawkishness pressure valuations.
Cross-asset positioning patterns suggest growing conviction in the reflationary narrative, with traditional defensive assets underperforming while cyclical and real asset strategies lead. Market breadth, however, has narrowed: after equal-weight indices outpaced in the first quarter on broadening participation, the second quarter saw leadership concentrate back into mega-cap technology, with cap-weighted indices reasserting their dominance. The reflationary trade is firmly in place at the index level, but the breadth that accompanied it earlier in the year has not persisted.
Looking ahead, the regime's durability depends on three critical factors: the sustainability of manufacturing sector momentum, the Fed's tolerance for growth-driven inflation persistence, and the global economy's ability to absorb accelerating U.S. demand without triggering supply bottlenecks. The current environment favors growth-oriented positioning, real asset exposure, and international diversification as the U.S. cycle leads global recovery patterns.
Source: RQA.